


Analysis updated to June 2026
Disclaimer
The information contained in this document is for educational and informational purposes only. It does not constitute an offer, recommendation, or financial, investment, legal, or tax advice. The opinions expressed reflect personal analysis and may be subject to change without notice.
Investing in financial markets involves risks, including the potential loss of all invested capital. Each reader or investor is responsible for conducting their own research and, if necessary, consulting with a registered financial advisor before making any investment decisions.
The author assumes no responsibility for any losses or damages arising directly or indirectly from the use of the information presented here.
Introduction

In January 2025, on the White House lawn, Larry Ellison appeared alongside Donald Trump, Sam Altman, and Masayoshi Son to announce Stargate , the most ambitious AI infrastructure project in history. Five hundred billion dollars were earmarked for building data centers across the United States. Oracle, alongside OpenAI and SoftBank, was one of the founding pillars of the project. The image was symbolic: the man who founded a database company in 1977 with $2,000, standing at the White House, committing Oracle as the technological backbone of the AI revolution.
To understand how we got here, we have to go back to the beginning.
Oracle’s story begins in 1977, when Larry Ellison, Bob Miner, and Ed Oates founded Software Development Laboratories in Santa Clara, California. Inspired by an IBM paper on relational databases, they built one of the world’s leading enterprise software companies. Their first contract was with the CIA. Not bad for a three-person startup.
In 1982, the company changed its name to Oracle Corporation, taking the name of its flagship product. By the mid-1980s, Oracle was synonymous with enterprise relational databases. The company went public in 1986 with a valuation of just $31 million and, despite internal crises and accounting setbacks during the 1990s, managed to establish itself as one of the pillars of global enterprise software.
The 2000s were the years of acquisitions. Oracle bought PeopleSoft in 2005 for $10.3 billion in one of the most memorable hostile takeovers in tech history (the battle lasted 18 months), then Siebel Systems in 2006, Sun Microsystems in 2010 (which brought Java and MySQL to the Oracle ecosystem), and dozens more companies. The strategy was to buy competitors, expand the product portfolio, and create an integrated enterprise ecosystem where Oracle was present at every layer of its customers’ technology stack.
The transition to the cloud was late. Amazon launched AWS in 2006 and by 2013 already dominated the cloud market. Microsoft Azure arrived later with force. Google Cloud followed. Oracle tried to build its own cloud too late, with a first generation of infrastructure that couldn’t keep up with the competition. The market punished it. Stocks remained flat for years while hyperscalers grew exponentially.
The turning point was the decision to build OCI Gen2 (Oracle Cloud Infrastructure 2) from scratch, with a different architecture: a flat network with ultra-low latency, isolated security by design (VMs from different customers don’t share hardware), and significantly lower prices than AWS. Clay Magouyrk (now co-CEO) was the architect of that infrastructure, having joined from Amazon Web Services.
And then came AI. Training large language models requires massive-scale GPU clusters with ultra-low network latency between nodes. OCI proved perfectly positioned for that workload, and Oracle signed contracts with Cohere, xAI (Elon Musk’s AI company), Meta, NVIDIA, and finally, OpenAI for Project Stargate. The backlog grew from $55 billion two years ago to $638 billion today.
Oracle was declared dead several times and found a way to reinvent itself from within.
Business Model
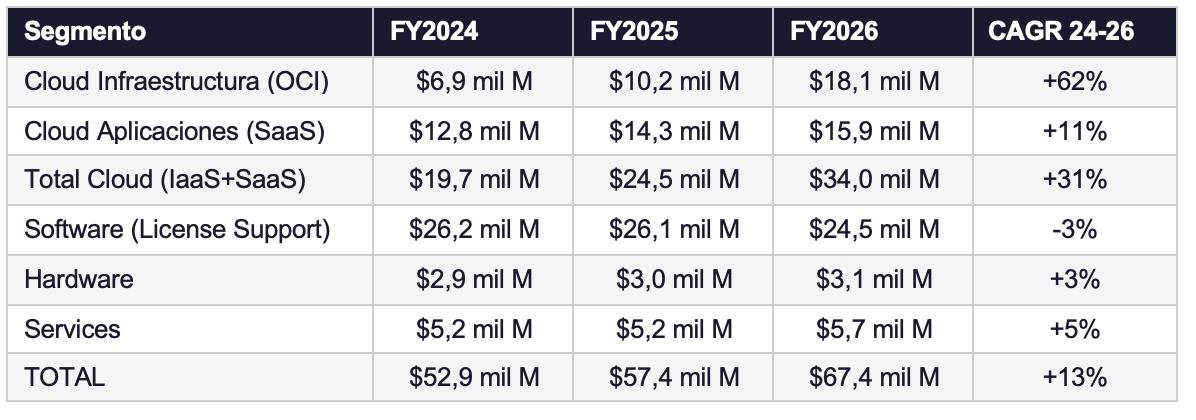
Oracle reports its results in three main segments , although to understand the business, I find it more useful to break it down into five major revenue streams. Each has different dynamics, margins, and growth drivers.
1. Cloud Infrastructure (OCI/IaaS)
It’s the fastest-growing business and the one transforming the company’s narrative. Oracle rents computing power in its data centers to customers who need to run workloads in the cloud: from databases to training AI models with billions of parameters.
OCI competes directly with AWS, Azure, and Google Cloud, but with some key differences. First, price: Oracle charges 30% to 50% less than AWS for equivalent workloads, and its data egress (the cost of extracting information from the cloud) is virtually nonexistent, whereas with AWS it can be very significant. Second, architecture: OCI was built with a bare-metal network (hardware without virtualization) that offers extremely low latency, making it especially well-suited for training AI models where GPU nodes need to communicate with each other with minimal latency.
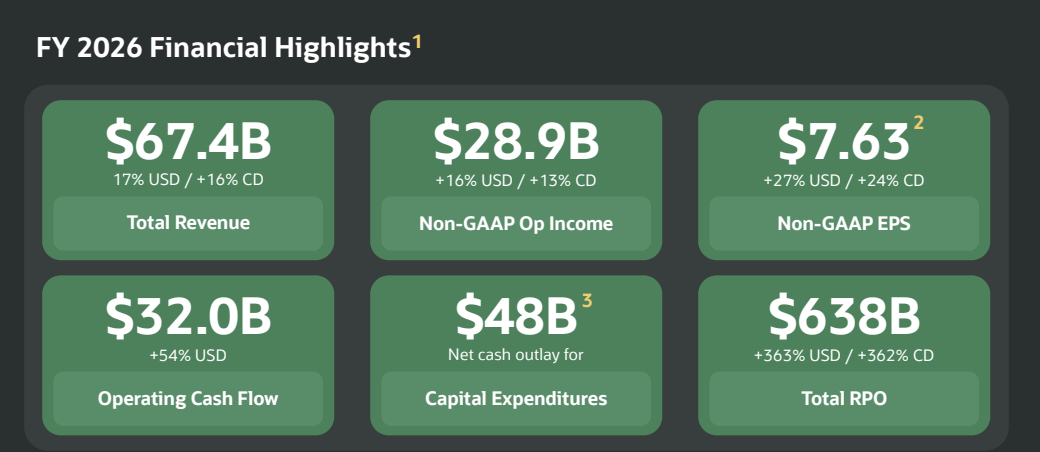
In fiscal year 2026, OCI generated $18.1 billion in revenue (+77% year-over-year) . In the fourth quarter of the fiscal year alone, growth was 93%. The company has 147 active cloud regions worldwide, with another 64 under construction. It is also deploying the Oracle Cloud@Customer initiative : dedicated data centers physically installed at customer premises for those who cannot move their data to the public cloud for regulatory or sovereignty reasons.
The $638 billion Remaining Performance Obligations (RPO) backlog at the close of Q4 FY26 is the most telling indicator of business traction. The majority of that backlog stems from AI contracts where customers prepaid Oracle for the GPUs (or supplied their own). This model dramatically reduces Oracle’s need for financing to build data centers.
2. Cloud Applications (SaaS)
Oracle has two cloud-based ERP (Enterprise Resource Planning) franchises. The first is Oracle Fusion Cloud ERP , which targets large enterprises (Fortune 500 and equivalent) and closed FY2026 generating revenues of approximately $4.2 billion (+18% year-over-year). The second is Oracle NetSuite , acquired in 2016 for $9.3 billion, which serves midsize businesses and generated approximately $4.1 billion in FY2026 (+16%).
Also within the SaaS sector is Oracle Health (Cerner’s business, acquired in 2022 for $28.3 billion). Oracle Health is the electronic health record provider for thousands of hospitals in the United States and around the world. Ellison’s strategy is to transform Oracle Health into the platform that integrates clinical patient data with AI models to accelerate diagnosis and drug development. It’s a long-term commitment that is still undergoing a transformation.
SaaS as a whole generated $15.9 billion in FY2026 (+11% year-over-year) . Growth is more moderate than that of OCI, but the fundamental characteristic of this business is its very high recurrence : contracts are annual or multi-year, the churn rate is very low, and customers tend to expand their use of Oracle over time (what is called positive net dollar retention in the industry).
3. Software (License Support & Cloud License)
This is Oracle’s historical business and still its largest source of revenue in absolute terms: $24.5 billion in FY2026 . It includes two components. The first is on-premise license support : customers who purchased Oracle database or application licenses years ago and pay an annual fee (typically 22% of the original license price) to receive updates and technical support. This business is a money-making machine, with extremely high operating margins and minimal marginal costs.
The second component is new on-premises licenses , which are declining as customers migrate to the cloud. This is expected and welcomed by Oracle: every customer migrating from on-premises to the cloud goes from paying for license support to paying for SaaS subscriptions or OCI consumption, generally at a higher cost.
4. Hardware
As a legacy of the Sun Microsystems acquisition, Oracle sells servers (Exadata, SPARC) and storage. With $3.1 billion in revenue in FY2026 , this segment is not strategic but is profitable for customers who prefer dedicated infrastructure in their own data centers. Growth was modest (+5%) and is not a driver of the investment thesis.
5. Services
Consulting, implementation, and education. With $5.7 billion in FY2026 (+10%) , this segment complements the rest of the portfolio and helps customers implement Oracle solutions. Margins are lower than software, but the business acts as a lubricant for the sales cycle.
Business Quality
Revenue and growth analysis
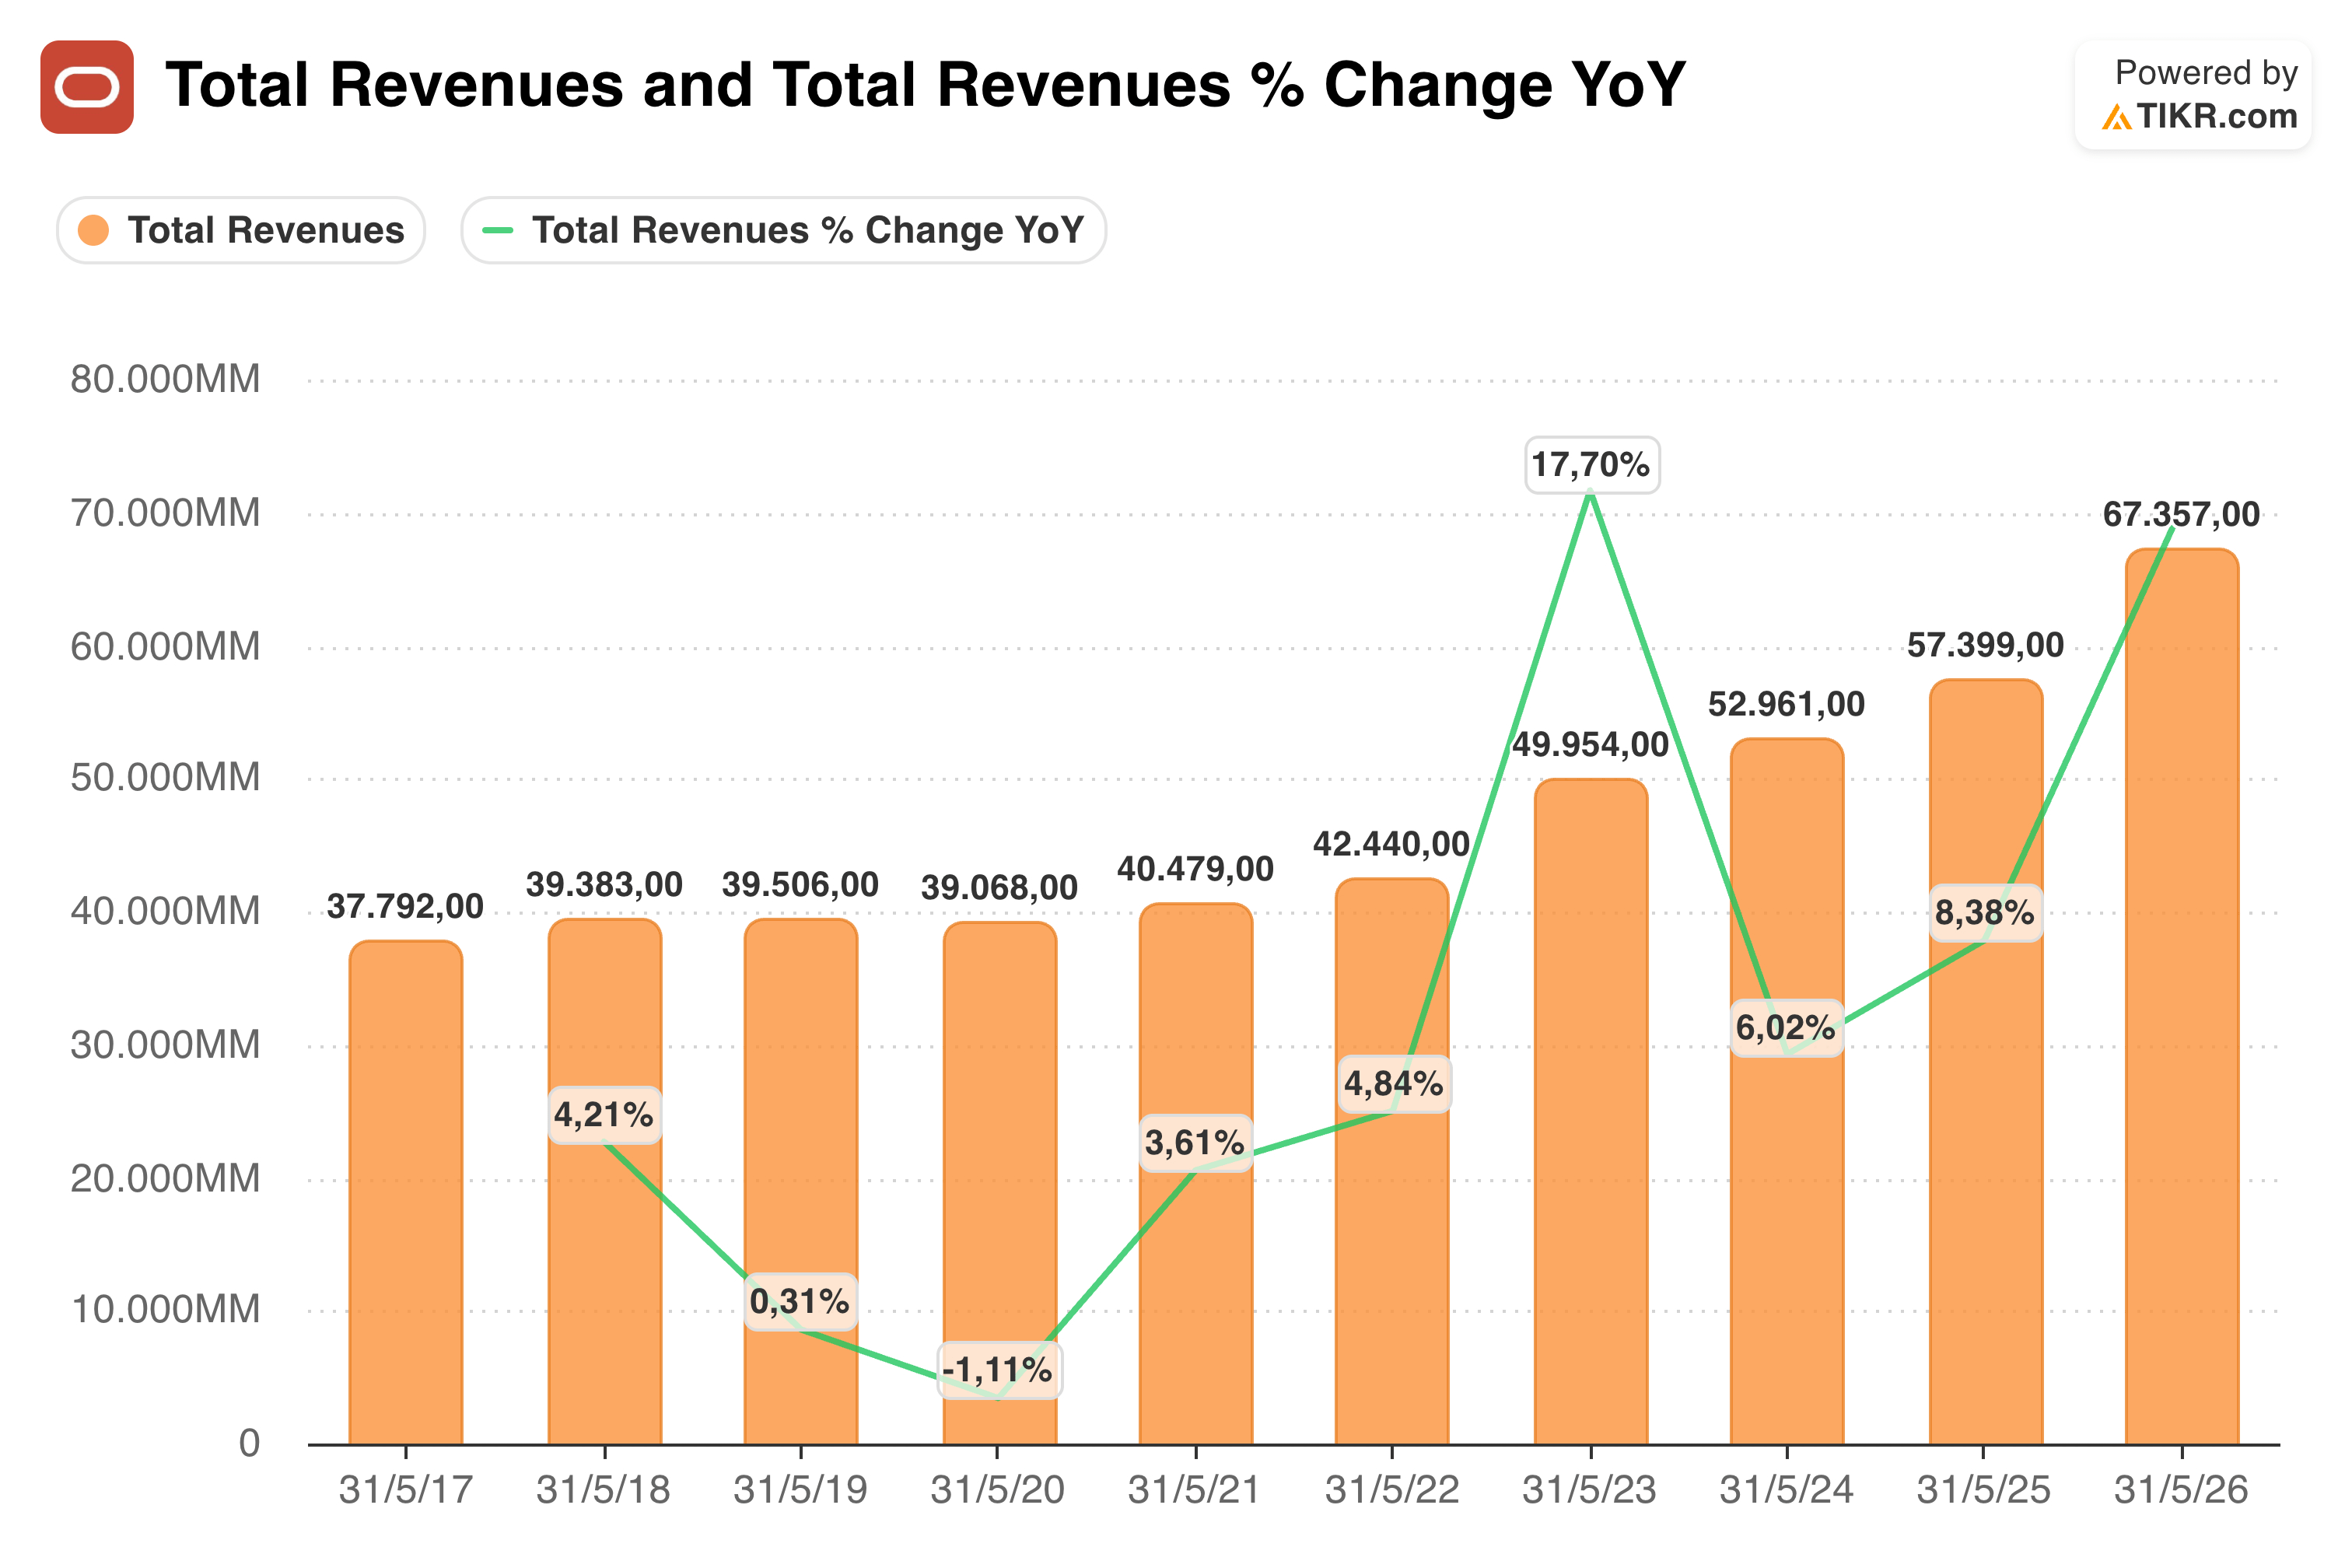
Oracle’s sales evolution clearly shows the change of stage the company is going through.
Between 2017 and 2022, Oracle was a moderately growing company. Its revenue increased from $37.792 billion in 2017 to $42.440 billion in 2022, reflecting slow expansion for a technology company. During that period, the business remained heavily reliant on its installed base, licenses, support, enterprise applications, and databases, with a gradual transition to the cloud, but without a visible leap in consolidated growth.
The first turning point came in 2023, when revenue grew 17.7% year-over-year to reach $49.954 billion . Part of that surge was due to the consolidation of Cerner, but it also marked the beginning of a more cloud- and recurring services-oriented Oracle. From then on, the company began to show a clearer acceleration compared to the previous stage.
In 2024 and 2025, growth remained positive, albeit more normalized, with sales of USD 52.961 billion and USD 57.399 billion , representing growth rates of 6.0% and 8.4% , respectively. These years are significant because they demonstrate that Oracle’s growth was not solely driven by a single acquisition, but rather that it began building a larger revenue base with greater exposure to the cloud.
The most significant figure comes in 2026. Oracle reached USD 67.357 billion in revenue, with a year-over-year growth of approximately 17% . This acceleration is key because it no longer responds solely to the integration of Cerner, but also to the increasingly strong growth of Oracle Cloud Infrastructure (OCI) and the demand for infrastructure for artificial intelligence.
Oracle has gone from being a mature software company with low growth to one that once again has a history of structural growth. The difference is that this new growth doesn’t come without a price: it’s associated with a very aggressive expansion of capital expenditures, data centers, GPUs, energy, and cloud capacity .
Therefore, the sales chart must be interpreted in conjunction with the evolution of free cash flow. Demand is emerging, but the key to valuation is whether Oracle can convert that growth into margin, return on capital, and sustainable cash flow . On the plus side, the company retains a very valuable characteristic: more than 85% of its revenue is recurring, which gives it uncommon visibility, even within the technology sector.
The revenue mix is systematically shifting toward the cloud. Three years ago, the cloud represented less than 40% of total revenue. Today, it exceeds 50%. In the fourth quarter of fiscal year 2026, the cloud (IaaS + SaaS) already accounted for 52% of total revenue for that quarter, with OCI driving this acceleration. The trajectory is clear.
Business seasonality exists but is moderate. Oracle, following the enterprise industry norm, tends to report its best numbers in the fourth fiscal quarter (ending in late May), when customers’ IT budgets are depleted and contract closings accelerate. The first quarter of the fiscal year (June-August) is typically the weakest.
Revenue evolution by segment (FY2024-FY2026)
Vertical analysis
Income Statement
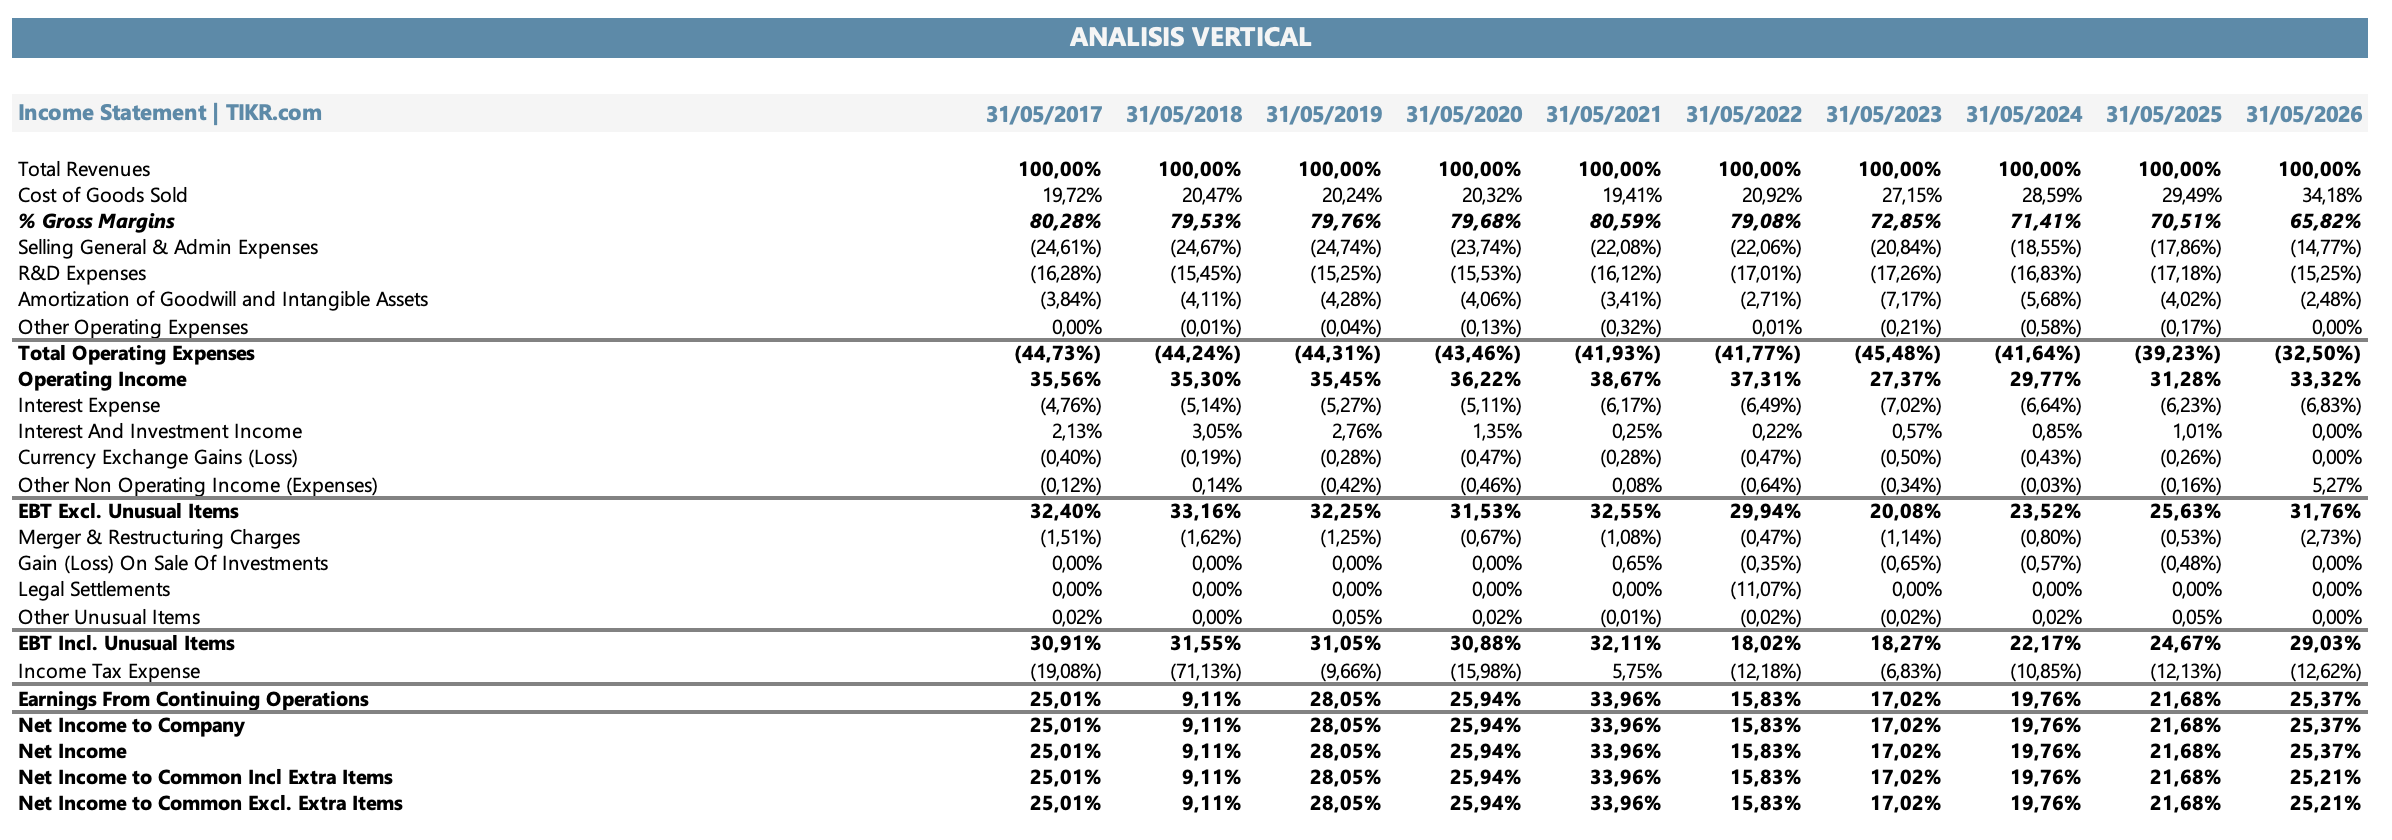
The vertical analysis of the income statement shows a company that continues to have a profitability structure well above the market average, although with clear signs of change in its business mix.
Between 2017 and 2022, Oracle maintained a gross margin close to 80% , a typical level for an enterprise software company with a very strong installed base, recurring revenue, support, licensing, and high-margin products. During those years, the gross margin remained fairly stable, fluctuating between 79% and 81% , reflecting the quality of Oracle’s historical business.
However, a more pronounced compression begins to emerge in 2023. The gross margin falls to 72.9% in 2023 , then to 71.4% in 2024 , 70.5% in 2025 , and finally 65.8% in 2026. This decline should not necessarily be interpreted as a structural deterioration of the traditional business, but rather as a consequence of the changing business mix. Oracle is increasingly expanding into cloud infrastructure , data centers, and artificial intelligence—businesses that are more cost-intensive than pure software.
Oracle may be entering a much more attractive growth phase, but with lower gross profitability. The company is shifting part of its historical software focus toward a more infrastructure-intensive model.
On the positive side, it managed to offset some of that pressure with greater operational efficiency. Selling, General & Admin expenses fell from nearly 24% of sales in 2017-2020 to 14.8% in 2026 , while R&D remained relatively stable at around 15-17% of sales. This shows a company that continues to invest in product, cloud, and artificial intelligence, but at the same time is making better use of its scale.
The result of all this is that the operating margin remained surprisingly strong. Oracle had operating margins of over 35% for much of the 2017-2022 period, fell to 27.4% in 2023 due to the impact of Cerner and other integration costs, but then recovered to 29.8% in 2024 , 31.3% in 2025 , and 33.3% in 2026 .
This recovery in operating margin is a positive sign. Despite the decline in gross margin, Oracle managed to protect operating profitability quite well through scale, efficiency in commercial expenses, and a lower relative weight of some operating items.
Further down the income statement, interest expense remains a significant line item. In 2026, it represented 6.8% of sales , indicating a more leveraged balance sheet structure. This is a crucial point, as Oracle is funding a substantial infrastructure expansion, which underscores the importance of monitoring debt, financing costs, and return on invested capital.
Finally, the net margin closed 2026 at 25.4% , a very high level for a company in the midst of an investment phase. This confirms that Oracle remains a company with extremely high operational quality. However, for valuation purposes, the net margin alone is insufficient. It’s not just about how much it earns on the books, but how much of that profit can be converted into free cash flow after the capital expenditures necessary to sustain OCI and the artificial intelligence infrastructure.
Balance Sheet
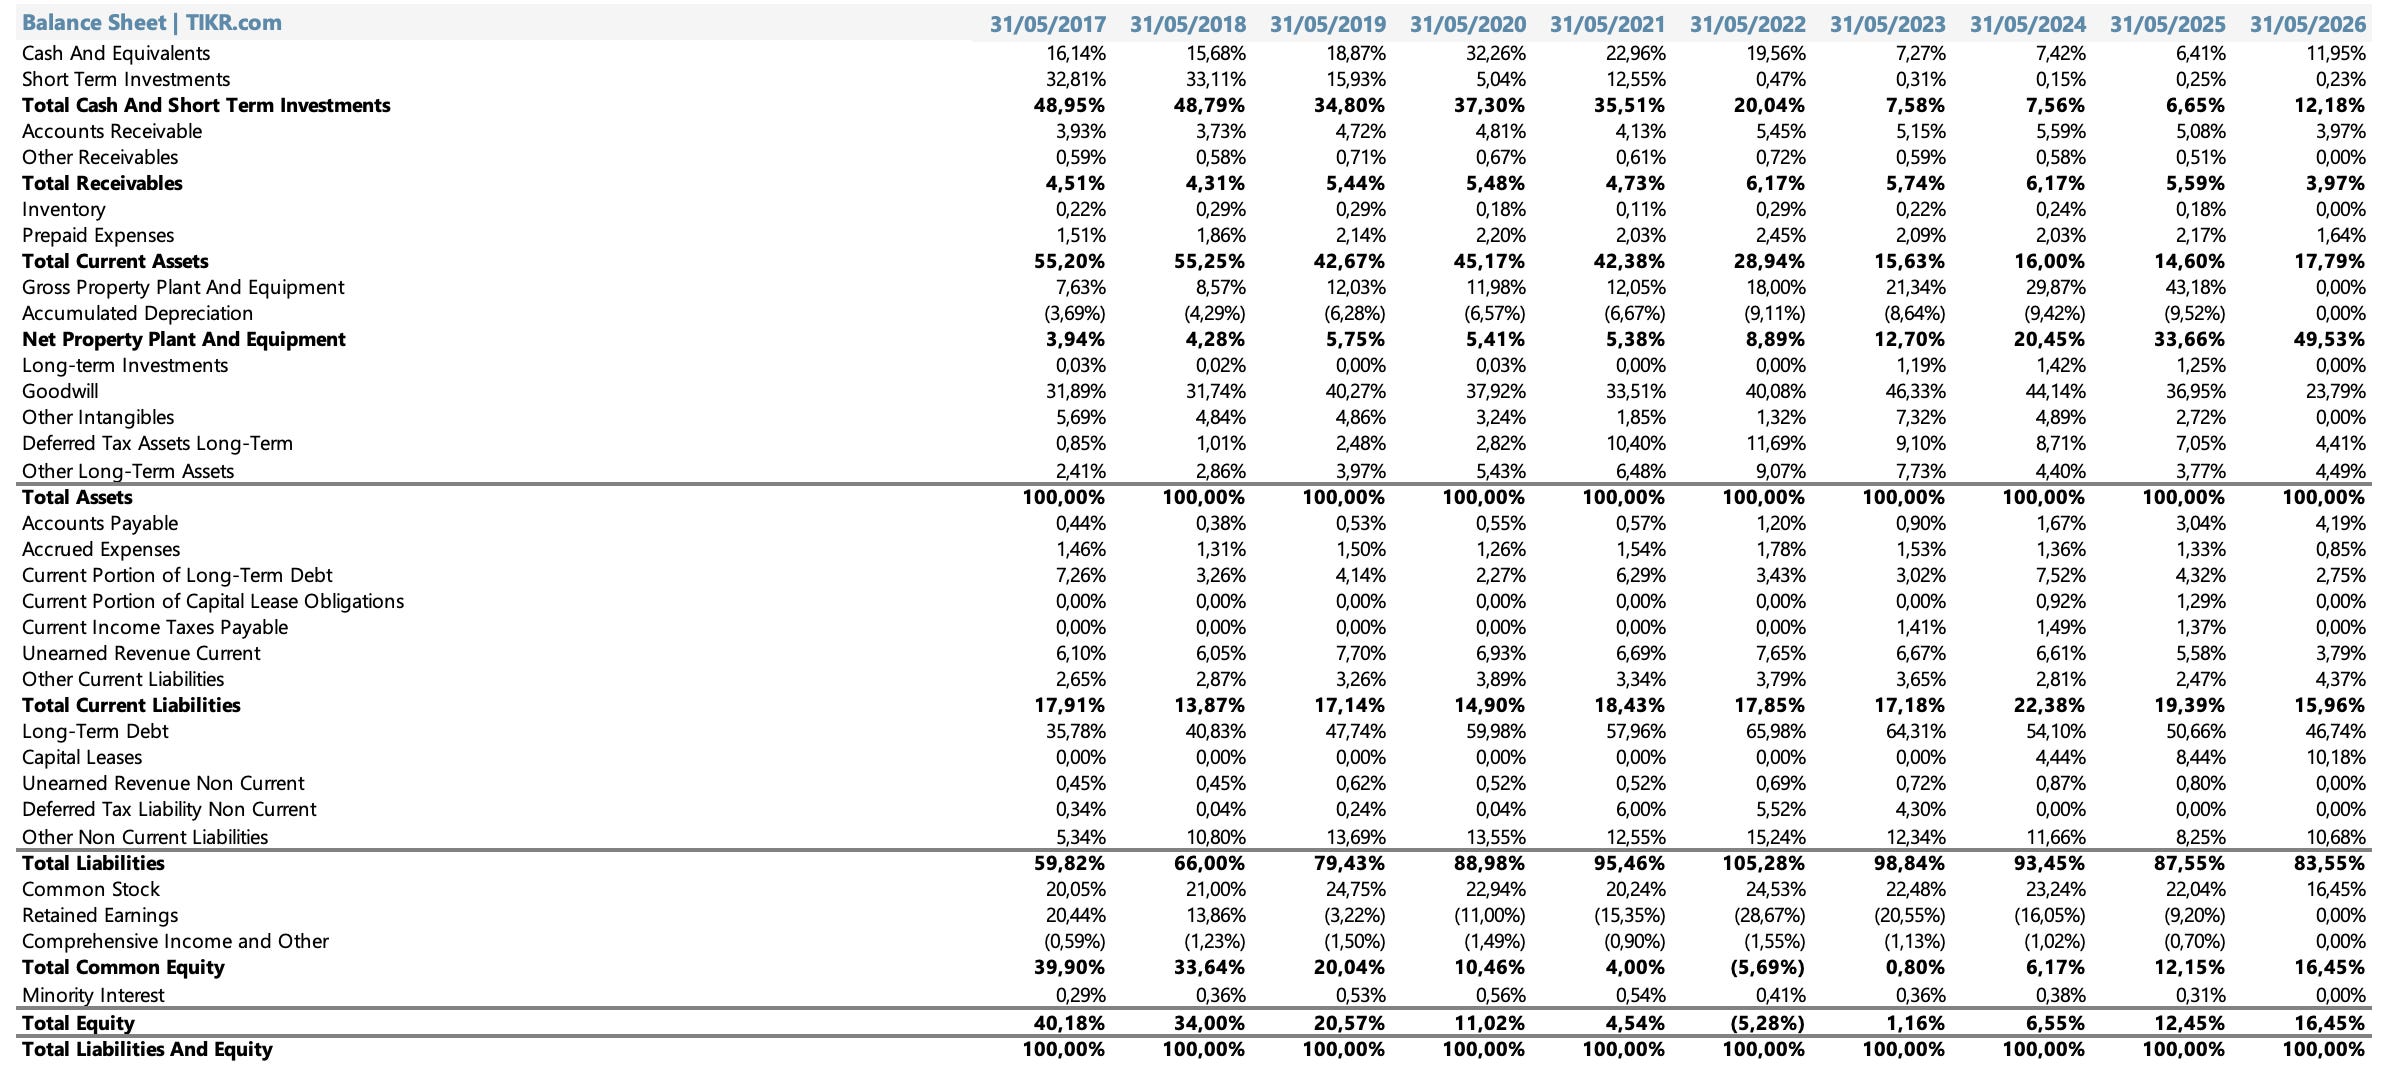
The balance sheet shows a profound transformation in Oracle’s asset structure: it went from having a much lighter balance sheet, with a significant proportion of cash and financial investments, to one increasingly loaded with physical assets, cloud infrastructure and debt.
The first significant change is in the composition of current assets. In 2017 and 2018, Oracle had a very high position in cash and short-term investments , close to 49% of total assets . This reflected a very liquid balance sheet and a company with strong financial capacity. However, that proportion fell significantly over time. By 2023, cash and short-term investments represented just 7.6% of assets , and although they rose to 12.2% in 2026 , the current balance sheet no longer resembles the cash-rich Oracle of the past decade.
The most significant change appears in net property, plant, and equipment . This line item went from representing only 3.9% of assets in 2017 to 49.5% in 2026. This is probably the most relevant figure in the entire balance sheet. Oracle is transforming into a much more capital-intensive company. The expansion of OCI, data centers, artificial intelligence infrastructure, and the physical capacity needed to fulfill cloud contracts are changing the nature of the business.
This point directly connects to the investment thesis. Oracle can no longer be analyzed solely as an asset-light software company. A growing portion of its value and risk lies in its ability to efficiently develop physical capital. If these assets achieve high utilization levels and good returns, Oracle can create significant value. Otherwise, the balance sheet may become heavier without generating the expected free cash flow.
The same shift is observed in the relative weight of goodwill. In 2023, it represented 46.3% of assets , influenced by the acquisition of Cerner, but by 2026 it had fallen to 23.8% . This wasn’t because it disappeared, but because physical assets grew much faster. Oracle’s balance sheet is ceasing to resemble that of a purely asset-light company.
On the liabilities side, debt remains a key factor. Long-term debt represented 46.7% of assets in 2026 , while capital leases reached 10.2% . This shows that Oracle is financing a significant portion of its expansion with debt and infrastructure-related obligations. The company still has scale, profitability, and access to capital, but the margin for error is smaller than when the business was leaner and generated abundant free cash with less need for reinvestment.
Another relevant point is the evolution of equity. For several years, net worth was very low or even negative, partly due to aggressive share buybacks and a leveraged capital structure. By 2026, equity has improved to 16.5% of assets , but this remains a low proportion relative to the size of the balance sheet and the expansion of physical assets.
Accounts payable also increase as a percentage of assets, rising from less than 1% in the early years to 4.2% in 2026. This may reflect increased investment activity, equipment purchases, and greater operational scale. However, I wouldn’t assume that Oracle will be able to finance its expansion indefinitely with suppliers. For valuation purposes, I prefer to normalize this line item prudently.
Cash Flow Statement
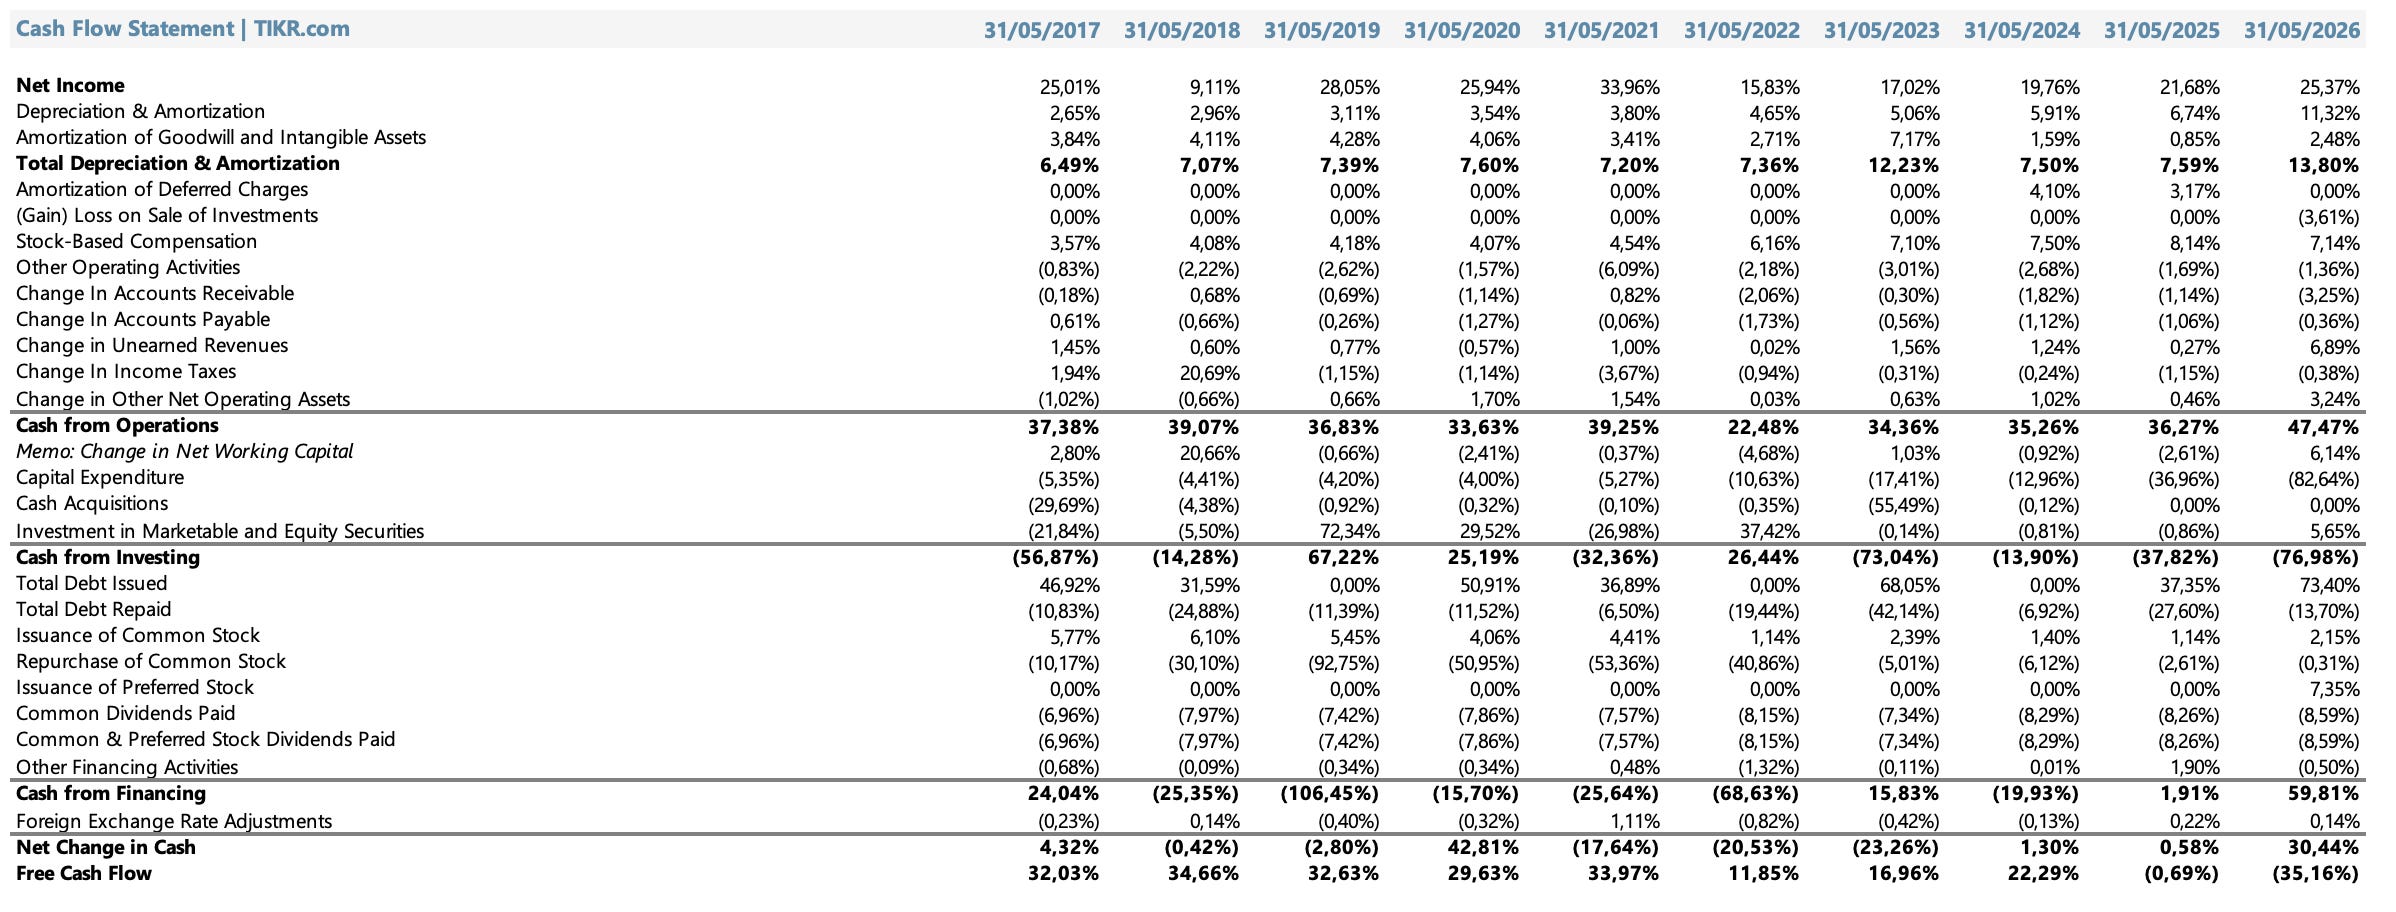
Vertical analysis of cash flow is probably the most important for understanding Oracle’s current situation. The income statement shows a profitable company, and the balance sheet shows a company undergoing transformation, but cash flow reveals the truth: Oracle generates a lot of operating cash, but capital expenditures are consuming an increasing portion of that cash .
Historically, Oracle has had an exceptional cash conversion rate. Between 2017 and 2021, cash from operations represented approximately 33% to 39% of sales —very high levels consistent with a high-quality enterprise software business. During those years, capital expenditures were low, generally between 4% and 5% of sales , which allowed for very high free cash flow.
Therefore, between 2017 and 2021, free cash flow remained at very solid levels, close to 30% to 34% of sales . That was classic Oracle: high margins, low capital intensity, recurring revenue, and plenty of cash available for share buybacks, dividends, acquisitions, or debt reduction.
The situation began to change in 2022 and accelerated sharply in recent years. By 2023, capital expenditures (capex) already represented 17.4% of sales . In 2024, this figure dropped to 13.0% , but in 2025 it rose sharply again to 37.0% . Finally, in 2026, capex reached 82.6% of sales , an exceptionally high level.
This figure summarizes Oracle’s turnaround better than any other. The company continues to generate operating cash flow; in fact, in 2026, cash from operations was equivalent to 47.5% of sales , a very strong level. But capital expenditures were so large that free cash flow ended up being negative, equivalent to 35.2% of sales .
This difference between operating cash flow and free cash flow is at the heart of the valuation. Oracle doesn’t have a demand or accounting profitability problem. The challenge is that, to capture the opportunity in OCI and artificial intelligence, it needs to invest massively before reaping the benefits.
This also explains the increased financing. In 2026, Oracle issued debt equivalent to 73.4% of sales and preferred stock equivalent to 7.4% of sales . The infrastructure expansion is not being financed solely with operating cash flow, but also with access to capital markets. In this context, the company retains significant operating cash flow, but a much larger portion of that cash is now being allocated to infrastructure development.
For valuation purposes, I believe this justifies giving more weight to the perpetuity method based on free cash flow than to the EBITDA multiple method. EBITDA may appear very high in a larger-scale Oracle, but if the company needs to continue investing tens of billions of dollars annually to maintain its infrastructure, the true value depends on the free cash flow remaining after that capital expenditure.
The cash flow statement reveals two realities simultaneously. The first is positive: Oracle remains a cash-generating machine. The second is more challenging: the new phase of artificial intelligence is absorbing a massive amount of capital.
Ratios
Liquidity ratios

Liquidity ratios show a company that consumed part of its financial flexibility as it accelerated its transformation to cloud and infrastructure.
Between 2017 and 2020, Oracle maintained a current ratio above 2x , reflecting a balance sheet with ample cash and short-term investments. But from 2021 onwards, liquidity began to tighten, reaching levels of 0.72x in 2024 and 0.75x in 2025 .
In 2026, an improvement is observed: the current ratio rises to 1.12x , the quick ratio to 1.01x , and the cash ratio to 0.76x . This is a positive sign, although Oracle no longer has the same excess liquidity it had during its more asset-light phase. With OCI growing and capex at record levels, liquidity is once again a key variable.
Solvency ratios
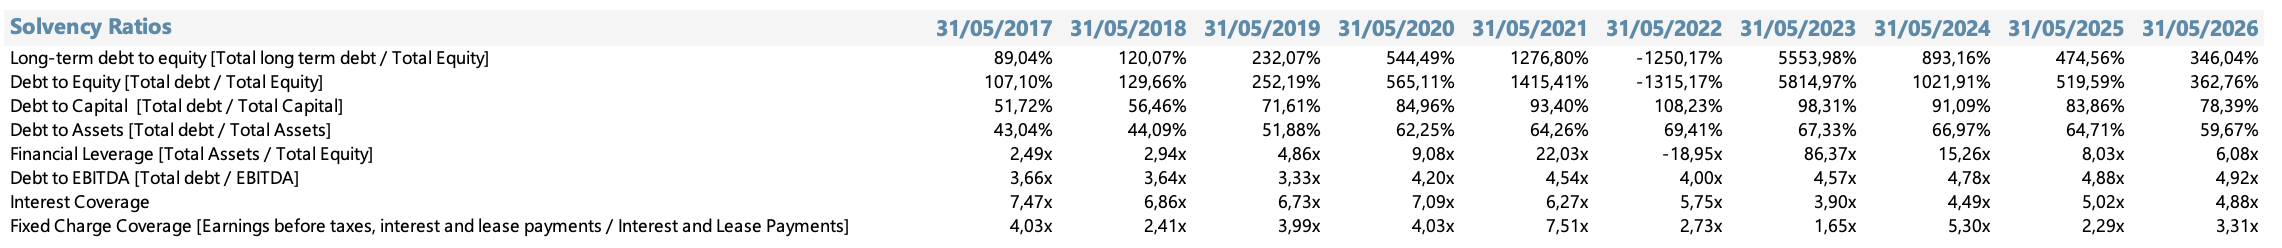
The solvency ratios clearly show what we have been seeing: the company remains profitable, but its capital structure is much more leveraged than that of a typical software company.
The long-term debt-to-equity ratio was high for almost the entire period analyzed, but it became particularly distorted in the years when accounting equity was very low or negative due to share buybacks and debt accumulation. Therefore, some ratios, such as debt-to-equity or financial leverage, should be interpreted with caution, as the denominator can exaggerate variations.
I find it more useful to look at debt-to-assets and debt-to-EBITDA ratios. The debt-to-assets ratio remained high, rising from 43% in 2017 to a peak of nearly 69% in 2022 , before gradually moderating to 59.7% in 2026. Although the recent trend shows some improvement, the absolute level remains high.
The debt-to-EBITDA ratio is also relevant. Oracle’s debt-to-EBITDA ratio rose from 3.66x in 2017 to levels close to 4.5x-4.9x between 2021 and 2026, closing the last year at 4.92x . For a mature software company, this level of leverage would be considered high. The market tolerates it in part because Oracle has recurring revenue, a very strong installed base, and high operating cash flow. However, in the current context, with extraordinary capital expenditures on OCI and artificial intelligence, the margin for error is smaller.
Interest coverage remained reasonable, although far from the more comfortable levels of the past. It fell from over 7x in 2017 to 4.88x in 2026. This is not a sign of immediate stress, but it does show that financial costs are having a greater impact on the earnings structure.
Performance ratios

Performance ratios show that Oracle still retains a very strong capacity for operational cash generation, even amidst a profound business model transition.
Cash flow to revenue : Between 2017 and 2021, Oracle generated cash from operations equivalent to approximately 33% to 39% of its sales , an extraordinary level characteristic of a high-quality enterprise software company. In 2022, it fell to 22.5% , but then recovered to 34.4% in 2023 , 35.3% in 2024 , 36.3% in 2025 , and finally 47.5% in 2026 .
This last piece of data is very significant. Oracle doesn’t have an operating cash flow problem. In fact, the company showed exceptional operating cash conversion in 2026. The problem arises later, when that cash is compared against the capital expenditure needed to expand OCI and the artificial intelligence infrastructure.
Cash return on assets remained relatively stable, hovering around 12% in recent years, and closing 2026 at 12.2% . This shows that, despite strong asset growth, Oracle is still able to generate a significant amount of operating cash flow from its asset base. However, this ratio will be key to monitor in the coming years. If the asset base continues to grow due to data centers and GPUs, but the CFO does not keep pace, return on assets could deteriorate.
Cash return on equity should be interpreted with caution, because Oracle’s book equity was distorted for years by share buybacks, debt, and relatively low equity. I wouldn’t consider it a primary metric of economic quality.
Activity ratios
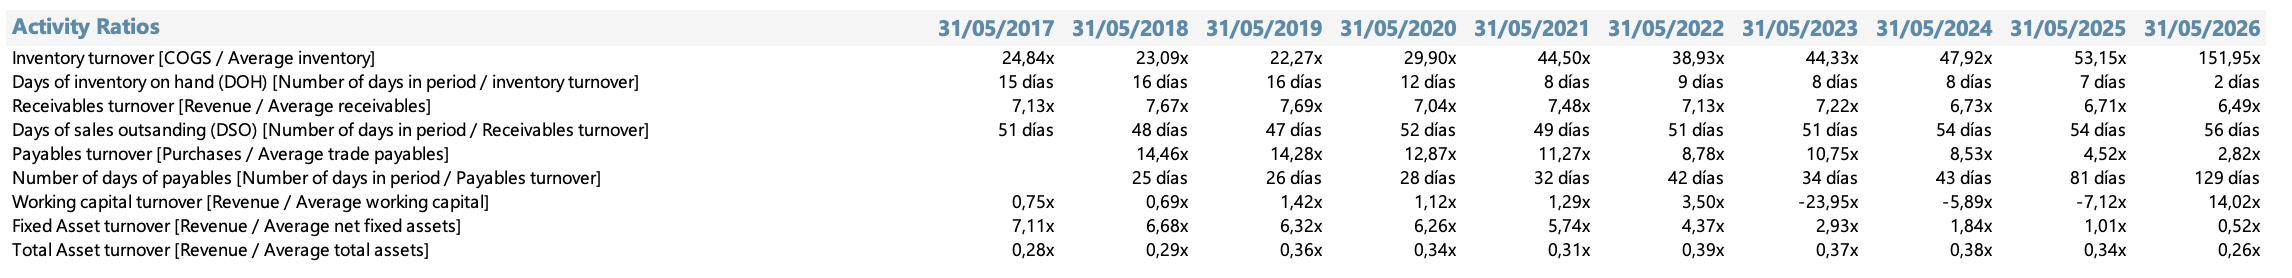
Oracle has historically been a software business with a relatively high turnover of fixed assets, but the expansion of OCI is changing that dynamic.
The most important ratio is fixed asset turnover . In 2017, Oracle generated revenue equivalent to 7.11x its average net fixed assets. This level was consistent with an asset-light software model, where revenue grew without the need for large physical investments. However, this ratio steadily declined to 0.52x in 2026 .
This decline is one of the clearest signs of Oracle’s structural shift. The company is accumulating a massive base of physical assets, data centers, cloud infrastructure, equipment, and artificial intelligence capabilities. In the short term, these assets are growing faster than the revenue they generate, which is why fixed asset turnover is falling so sharply.
This isn’t necessarily a bad thing. During a construction phase, it’s normal for asset turnover to decline. The question is whether Oracle will be able to increase the utilization of that infrastructure and convert those assets into high-return revenue. If it fails, the balance sheet will be burdened with underperforming assets.
Total asset turnover also declined, closing 2026 at 0.26x , compared to levels close to 0.34x-0.39x in previous years. This confirms that the balance sheet has become heavier. Oracle needs increasingly more assets to generate each dollar of revenue.
Regarding accounts receivable, days sales outstanding remained relatively stable, around 48 to 56 days , closing 2026 at 56 days . This is reasonable for an enterprise company with large corporate clients. I don’t see this as a serious sign of deterioration in collections, although it is advisable to monitor whether the growth in RPO and large contracts is accompanied by overly lenient commercial terms.
Payable days rose sharply to 129 days in 2026 , likely reflecting the scale of infrastructure, equipment, and cloud-related vendor purchases. This temporarily helps working capital, as Oracle is able to finance part of its expansion through vendors. However, I wouldn’t assume this level is sustainable indefinitely. In a DCF scenario, it’s more prudent to normalize it gradually.
Inventory is not a significant driver for Oracle. Although the ratio shows a very high turnover in 2026, this has little economic impact because the company does not operate like a traditional industrial business.
Profitability ratios

Oracle remains very profitable, but returns on capital are starting to compress as it becomes more asset-intensive.
Operating ROA remained in double digits for much of the period, but fell to 9% in 2026. This reflects the rapid growth of the asset base due to infrastructure expansion, while the profitability of those assets is still maturing.
Net ROA remained relatively stable in recent years, hovering around 6% to 7% , and closing 2026 at 7% . For a company undertaking such an aggressive capex cycle, this is not a bad level.
ROE is extremely volatile and should be interpreted with caution. Oracle has had years of very low or even negative accounting equity due to share buybacks, debt, and capital structure, which distorts the ratio. ROE is projected at 40% in 2026 , but I wouldn’t use this number as the primary indicator of quality. It’s useful as a benchmark, but not as a core metric.
The most relevant ratio for me is ROIC . Oracle went from very attractive levels, such as 18% in 2019 , 17% in 2020 and 2021 , and even 23% in 2022 , to 15% in 2023 , 15% in 2024 , 14% in 2025 and 11% in 2026 .
This drop in ROIC is probably the most important indicator in the profitability segment. Oracle continues to generate positive returns, but invested capital is growing much faster due to the expansion of OCI. In the short term, this is putting pressure on ROIC. The million-dollar question is whether this decline is temporary, typical of an investment phase, or whether it reflects that the cloud infrastructure business will have lower returns than Oracle’s historical performance.
The answer is crucial. If ROIC expands again as the infrastructure is better utilized, the current investment can create significant value. But if ROIC remains near lower levels, Oracle could grow considerably without necessarily generating the economic return the market expects.
In summary, the vertical analysis and ratios show Oracle in the midst of a transition. The company remains highly profitable, with high operating margins and strong operating cash flow, but the model has changed: it’s no longer just asset-light software; now it also encompasses cloud infrastructure, data centers, and artificial intelligence.
This is reflected in the decline in gross margin , the sharp increase in property, plant and equipment , the pressure on free cash flow , and the lower ROIC . Oracle retains a very high-quality core business, but now needs significantly more capital to grow.
Management Team
Larry Ellison (Founder, Chairman and CTO)
You can’t talk about Oracle without talking about Larry Ellison. The man is the company, the company is the man. At 81, he remains the largest shareholder (with approximately 40% of the shares), the greatest strategic asset, and the mastermind behind every significant move of the last five years.
Ellison grew up on the South Side of Chicago from poverty, attended college twice without graduating, and arrived in Silicon Valley in the 1960s with the ambition to build something big. What he built was the world’s second-largest software company by revenue, with a personal fortune that, at some point during the Q3 results in September 2025, briefly made him the richest person on the planet.
His leadership style is direct, competitive to the point of aggression, with a tolerance for risk that sometimes unsettles Wall Street analysts. He owns the Hawaiian island of Lanai, competes in offshore sailing, and on earnings calls speaks with the conviction of someone unafraid to make extraordinarily ambitious predictions. In Q3 of FY2026, he projected that OCI would reach $144 billion in revenue by 2030. That was interpreted by some as exaggerated and by others as a vision that Ellison himself is determined to execute.
As CTO, Ellison leads product strategy and data architecture. His current obsession is to transform Oracle into the unified health record system for global healthcare: a platform where every patient’s medical records worldwide are available to physicians and AI models that will accelerate the development of personalized drugs and therapies.
Clay Magouyrk (Co-CEO)
Magouyrk joined Oracle in 2014 directly from Amazon Web Services and was one of the key architects of OCI Gen2. He knows the cloud infrastructure business inside and out: he understands why AWS is where it is, and also where its weaknesses lie. In September 2025, when Safra Catz moved to an Executive Vice Chair role, he was promoted (along with Sicilia) to the position of CEO. His focus is on the infrastructure business, data center expansion, and relationships with major AI clients.
Mike Sicilia (Co-CEO)
Sicilia joined Oracle through the acquisition of Primavera Systems and built his career leading the company’s vertical application businesses: healthcare, banking, communications, utilities, and hospitality. His signature has been the integration of AI agents into Oracle’s industrial application suites, transforming enterprise management software into platforms that not only record data but also act upon it.
Safra Catz (Executive Vice Chair)
Catz led Oracle from 2014 (first as co-CEO alongside Mark Hurd and from 2019 as sole CEO) until September 2025. Born in Israel, she trained as an investment banker and joined Oracle in 1999. Her tenure was marked by financial discipline, the execution of major acquisitions (Cerner), and the stabilization of the business during the transition to the cloud. Her continued presence on the board as Executive Vice Chair alongside Ellison speaks volumes about how much the company values her.
Competitiveness
Industry and market size (TAM)
Oracle operates in multiple large and growing markets. The cloud infrastructure (IaaS) market is currently valued at around $250 billion annually and is growing at approximately 25% per year. By 2030, the most conservative projections place it above $600 billion. The cloud ERP (enterprise resource planning) market is estimated at $90-120 billion and is growing at 15% annually. The healthcare IT market is another $40-60 billion market and is undergoing rapid digitalization.
The most important catalyst for all these markets in the coming years is AI. Every company on the planet is trying to understand how to integrate AI language models and agents into its operations. Oracle, which owns both the infrastructure (OCI) and the enterprise applications (Fusion ERP, NetSuite, Oracle Health), is uniquely positioned to offer an integrated solution: the customer doesn’t have to choose between the cloud and enterprise software; Oracle gives them both.
The moat: why customers don’t leave
The concept of switching cost is central to understanding Oracle. Oracle databases have been storing the most critical data of the world’s largest companies for decades: accounting records, customer data, inventories, medical records. Moving that information to another system is not only expensive in terms of licensing or technical migration. It’s risky in a way that CIOs are simply unwilling to accept.
The magnitude of that lock-in is extraordinary. Oracle has over 40% market share in relational databases . By 2024, it surpassed SAP as the world’s largest enterprise ERP provider for the first time ever, with $8.7 billion in ERP revenue and a 6.6% share of the global market. That may seem small as a percentage, but in absolute terms, it’s number one.
The multicloud strategy is another key element of the moat. Oracle has partnered with AWS, Azure, and Google Cloud to deploy Oracle Database directly within its competitors’ data centers ( Oracle Database@Azure , Oracle Database@AWS , Oracle Database@Google Cloud ). This might seem contradictory (why help the competition?), but it’s actually brilliant: Oracle continues to collect its database license fees even if the customer chooses a third-party cloud. And at the same time, it makes Oracle Cloud Interface (OCI) the easiest option for migrating the most demanding workloads.
Growth Drivers
1. The demand for AI infrastructure: Large language models continue to scale. Training GPT-5 or equivalent models requires tens of thousands of GPUs running in parallel for weeks. OCI is currently one of the few providers capable of delivering that scale with the required network latency.
2. Migration from on-premises to the cloud: Oracle has thousands of customers who still run their databases and ERP applications on their own servers. The pressure to migrate to the cloud (reduced operating costs, automatic updates, AI integration) is growing. Each migration means higher revenue for Oracle Cloud.
3. Oracle Health as a healthcare data platform: Ellison’s vision is to build a unified repository of clinical data that will enable AI models to accelerate drug discovery and improve diagnosis. If this project materializes within the next five years, Oracle Health could become one of the most valuable technology companies on the planet.
4. Geographic and sovereign expansion: Oracle Cloud@Customer enables the deployment of cloud infrastructure in countries and organizations that cannot export their data. This is a unique value proposition compared to North American hyperscalers, especially in Europe and Asia.
5. AI embedded in SaaS applications: Fusion and NetSuite are being equipped with AI agents that automate accounting, supply chain, and human resources processes. This gives them greater pricing capabilities and reduces churn.
Porter’s Five Forces
Customer bargaining power: LOW/MEDIUM. Enterprise customers have low bargaining power once they are within the Oracle ecosystem. Migrating an Oracle database that has been running a company’s critical processes for 15 years is a multi-year project with enormous operational risk. Bargaining power is somewhat higher in new OCI contracts, where customers can compare prices with AWS and Azure.
Supplier bargaining power: MEDIUM. Oracle relies on NVIDIA for GPUs in its data centers. NVIDIA’s concentration in the AI chip market gives it considerable power. However, Oracle has signed long-term agreements and is developing relationships with alternative manufacturers (AMD, Intel) to reduce this dependence.
Threat of new entrants: LOW. Barriers to entry in the enterprise software and cloud infrastructure market are extremely high: decades of product development, billions in capital expenditures, a massive installed base, and deep institutional relationships. A startup cannot replace Oracle Database.
Threat of substitute products: MEDIUM. In databases, open-source products (PostgreSQL, MySQL) and NoSQL (MongoDB) have gained ground in modern applications. But for the most critical enterprise workloads, Oracle remains the standard. In the cloud, native services from AWS, Azure, and GCP compete with OCI.
Competitive rivalry: HIGH. In cloud infrastructure, competition with Amazon, Microsoft, and Google is intense. In ERP, SAP remains the major historical rival. But Oracle has the advantage of being able to compete on integrated layers that its competitors cannot easily replicate: infrastructure + database + enterprise applications in a single ecosystem.
SWOT Analysis
Strengths: Extensive installed customer base with exceptional switching costs. Leadership in enterprise databases (40% market share). Unique position at the intersection of cloud infrastructure and enterprise applications. OCI architecture designed for AI workloads. Competitive pricing (30-50% less than AWS). $638 billion backlog providing unparalleled visibility.
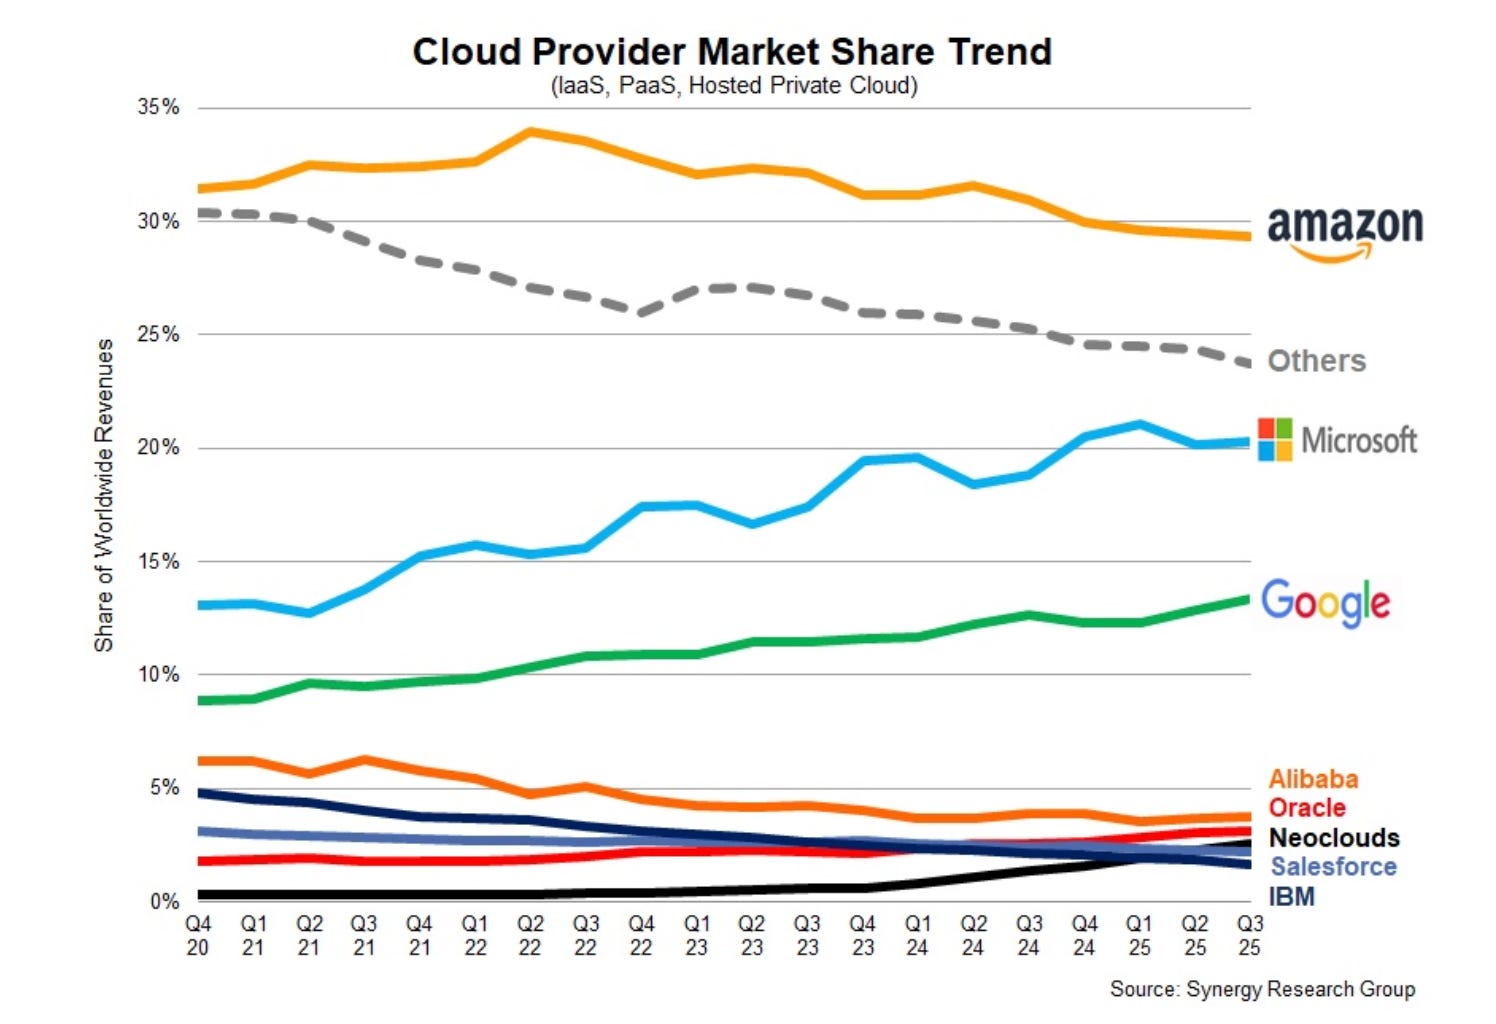
Weaknesses: High debt (over $100 billion). Negative free cash flow in FY2026 due to the investment cycle. OCI has only ~3% global cloud market share compared to AWS’s 29%. The Cerner integration has not yet generated the expected returns. Dependence on on-premises revenues, which are in structural decline.
Opportunities: AI as a super-catalyst for cloud infrastructure demand. Migration of thousands of on-premises customers to the Oracle cloud. Oracle Health as a global health data platform. Sovereign expansion in Europe, the Middle East, and Asia. Multicloud as an entry point to OCI for AWS and Azure customers.
Threats: Slowdown in AI investment if the industry’s capital expenditure cycle cools. Competition from Amazon, Microsoft, and Google with much larger financial resources. Dependence on NVIDIA for GPUs. Risk of execution issues in the accelerated construction of data centers. Potential regulatory problems regarding data concentration (especially in healthcare).
Main Competitors
Amazon Web Services (AWS): The market leader in cloud infrastructure with approximately 29-30% global market share. Cloud revenue is around $105-115 billion over the past twelve months. AWS has the greatest depth of services, the largest developer community, and the largest number of enterprise customers. Its disadvantages compared to OCI are its higher price, network latency for intensive workloads, and data egress costs.
Microsoft Azure: The second largest in the market (~20% share), benefiting from integration with OpenAI and Microsoft 365 products. Oracle’s relationship with Azure (Oracle Database@Azure) is unique: they are both competitors and partners. Azure grew by approximately 30% in the last year, primarily driven by demand for AI.
Google Cloud: Third in the market (~13% share) and the fastest growing among the Big Three. Google’s competitive advantage lies in its expertise in AI/ML and its data ecosystem (BigQuery, Vertex AI). It also shares a competitor/partner dynamic with Oracle.
SAP: The long-standing rival in enterprise ERP. SAP has a massive installed base (over 400,000 customers in 190 countries) and has been running its own cloud migration with SAP S/4HANA for years. The Oracle vs. SAP ERP battle is one of the longest-running and most interesting in the enterprise world. Oracle surpassed SAP in ERP revenue for the first time in 2024.
Salesforce: A competitor in CRM and, increasingly, in enterprise AI platforms (Agentforce). It doesn’t compete directly in databases or infrastructure, but it does compete in the SaaS application segment.
Valuation
Valuing Oracle today is considerably more difficult than valuing the Oracle of its history. For many years, the company was viewed as a mature enterprise software company with recurring revenue, high margins, low capital expenditures, and relatively predictable cash conversion. That Oracle still exists, particularly in databases, applications, support, and long-term relationships with large corporate clients.
But the Oracle I’m valuing today isn’t exactly the same. The company is undergoing a major transformation, driven by the growth of Oracle Cloud Infrastructure , the demand for AI computing, and massive contracts with customers who need data center capacity, GPUs, networking, power, and storage.
How much of that growth will actually translate into free cash flow for the shareholder ?
That’s the key, in my opinion. Oracle may show very strong revenue growth, an impressive backlog, and OCI expansion, but if capturing that opportunity requires investing tens of billions of dollars annually in infrastructure, value creation will depend on the ultimate return on that investment.
Projection horizon
For Oracle I use a model of 10 explicit years + terminal year .
I divide the projection into three stages:
2027F to 2030F: aggressive expansion stage, with high growth and exceptionally high capex.
2031F to 2033F: transition stage, where OCI continues to grow but begins to improve operational efficiency and infrastructure utilization.
2034F to 2036F + terminal year: stage of greater maturity, with more moderate growth, more stable margins and capex as a percentage of sales more normalized.
Revenue growth
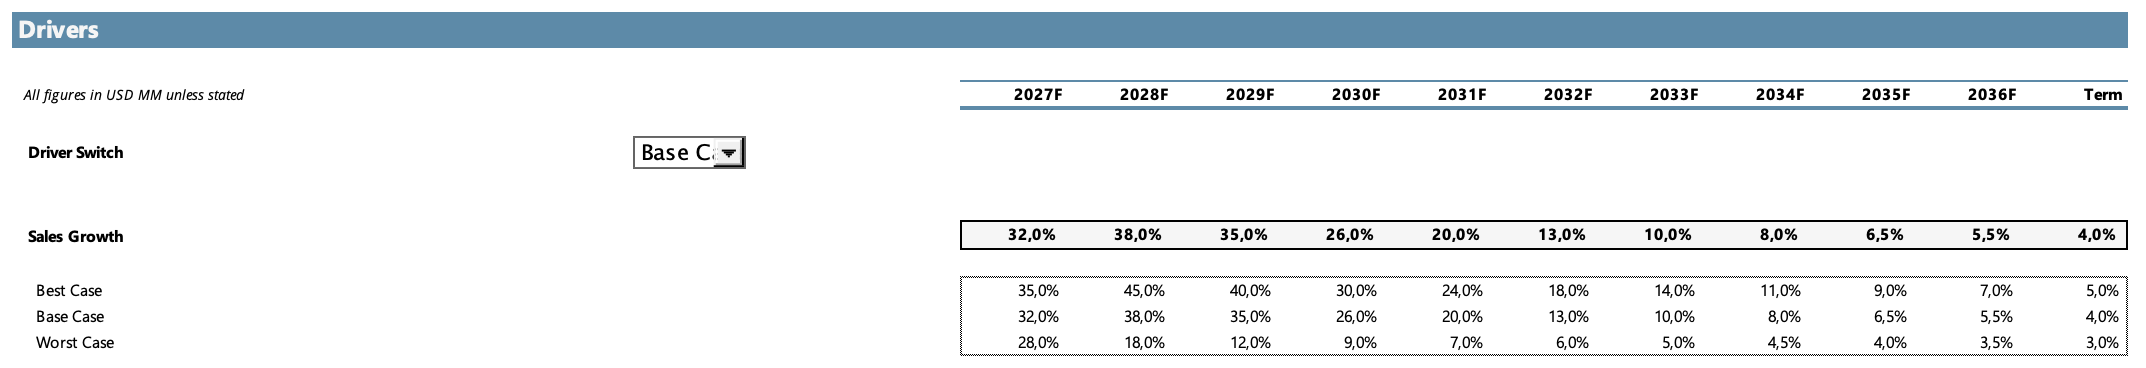
In the base scenario, I project very high revenue growth in the first few years, especially due to the increasing weight of OCI and the contracted RPO. Oracle closed FY2026 with an RPO of approximately $638 billion , a figure that reflects very strong future demand and justifies assuming several years of growth above the company’s historical average.
In my base scenario, revenue grows 32% in 2027 , then 38% in 2028 , 35% in 2029 , and 26% in 2030. From there, I assume a gradual normalization to a terminal growth of 4% .
This assumption does not imply that Oracle will grow at extraordinary rates forever. The idea is to reflect that the company has a very strong growth window ahead, but that this growth should moderate as the revenue base becomes much larger.
In the best-case scenario , I assume Oracle executes its AI infrastructure expansion very well, converts RPO into revenue with minimal delay, and manages to capture a significant share of global spending on accelerated computing. In that case, growth remains higher for a longer period.
In the worst-case scenario , I assume demand exists, but there is also increased competition, delays in capacity deployment, lower utilization, price pressure, or less profitable contracts than expected. In that scenario, Oracle continues to grow, but the growth rate slows down more rapidly.
Gross margin

Gross margin is one of the most important inputs to the model because Oracle is changing its business mix.
Traditional Oracle, associated with software, licenses, support, databases, and enterprise applications, can sustain very high margins. However, OCI and AI infrastructure are more asset-intensive businesses. They require GPUs, data centers, electricity, networking, cooling, maintenance, technology upgrades, and a physical scale that did not exist to the same degree within Oracle’s historical model.
Therefore, in the base scenario, I don’t assume that Oracle will indefinitely maintain the gross margin profile of a pure software company. I project a gross margin of 68% in 2027 , declining to 67% in 2029 and 2030 , before gradually recovering to 70% in the final year .
The initial decline reflects the increasing weight of OCI and the associated infrastructure costs. The subsequent recovery reflects greater scale, better utilization of data centers, greater absorption of fixed costs, and a still relevant mix of software, applications, databases, and support businesses.
In the best case , the terminal gross margin reaches 72% , which implies that Oracle manages to maintain a very profitable mix between software and cloud, with good pricing discipline and operational efficiency.
In the worst case , the terminal gross margin is 64% , reflecting a less profitable OCI, greater competitive pressure, and an AI infrastructure that consumes more resources than expected.
EBIT margin

I also project the EBIT margin with a transitional logic.
In the base scenario, Oracle starts with an EBIT margin of 36% in 2027F , falls slightly to 35% in 2028F and 2029F , and then gradually improves back to 35% in the terminal year .
This trajectory attempts to capture two opposing forces.
On the one hand, Oracle maintains highly profitable businesses with strong recurring revenue, a deep installed base, and a difficult-to-replace enterprise ecosystem. This gives it a superior profitability structure compared to most pure infrastructure companies.
On the other hand, the expansion of OCI implies a more operationally cumbersome company. Selling incremental software is not the same as building and operating data centers for artificial intelligence models. Therefore, although Oracle may remain very profitable, I don’t think it’s prudent to assume it will fully recover the economic profile of the more asset-light Oracle.
In the best case scenario , the terminal EBIT margin reaches 40% . This scenario assumes very solid execution, significant scale in OCI, good capacity utilization, and a revenue mix where software, applications, and databases continue to be substantial.
In the worst case , the terminal EBIT margin is 28% , reflecting a company that is growing, but with lower returns, greater competitive pressure, and a less attractive operational conversion.
CAPEX

Capex is another of the most relevant assumptions in the entire valuation.
Oracle closed FY2026 with an exceptionally high level of capital expenditure, driven by the need to build infrastructure for OCI and AI customers. Furthermore, the company anticipates that FY2027 will be another year of very high investment.
Therefore, in the base scenario, I use a capex equivalent to 78% of 2027 sales . It’s a very high number, but necessary to reflect the company’s current reality. Oracle isn’t simply selling more software. It’s building physical capacity to fulfill cloud and artificial intelligence contracts.
From there, I project a gradual normalization: 58% in 2028F , 42% in 2029F , 32% in 2030F , and then a progressive decrease to 13% in the terminal year .
I don’t assume Oracle will return to low capex as a percentage of sales. Even in the final year, I maintain a significant capex level because a mature OCI will still require maintenance, hardware upgrades, GPU replacements, capacity expansion, power, cooling, and networking.
This point is central to the thesis. If Oracle becomes a much larger AI infrastructure platform, it will also be a more capital-intensive company. That doesn’t mean it can’t create value, but it does mean that free cash flow needs to be analyzed more carefully.
In the best-case scenario , capital expenditures (capex) decrease faster because Oracle achieves greater efficiency, better utilization, and higher financing or economic contributions from customers. In the worst-case scenario , capex remains high for a longer period, reflecting a more expensive infrastructure, lower efficiency, or a constant need for reinvestment to maintain competitiveness.
Working capital

For working capital, I use unified assumptions for all scenarios because I don’t believe they are the primary driver of the difference between best, base, and worst case estimates. The main variables that explain the value dispersion are revenue growth, margins, capex, and terminal multiple.
For accounts receivable, I use approximately 55 days , which is consistent with the profile of an enterprise company with large contracts and corporate clients. Oracle sells to governments, large corporations, and hyperscalers, so I don’t expect an extremely short collection cycle.
I maintain a low assumption regarding inventory. Oracle is not a traditional industrial company and should not be modeled as having structurally relevant inventory. While there may be certain components or equipment associated with infrastructure, inventory is not the primary economic driver.
In accounts payable, I use a gradual normalization from high levels to more stable levels. Oracle likely maintains some negotiating power with suppliers due to the scale of its purchases, but I don’t want to assume it can indefinitely finance its expansion with exceptionally favorable terms. At such a high capex stage, this assumption should be tempered.
WACC
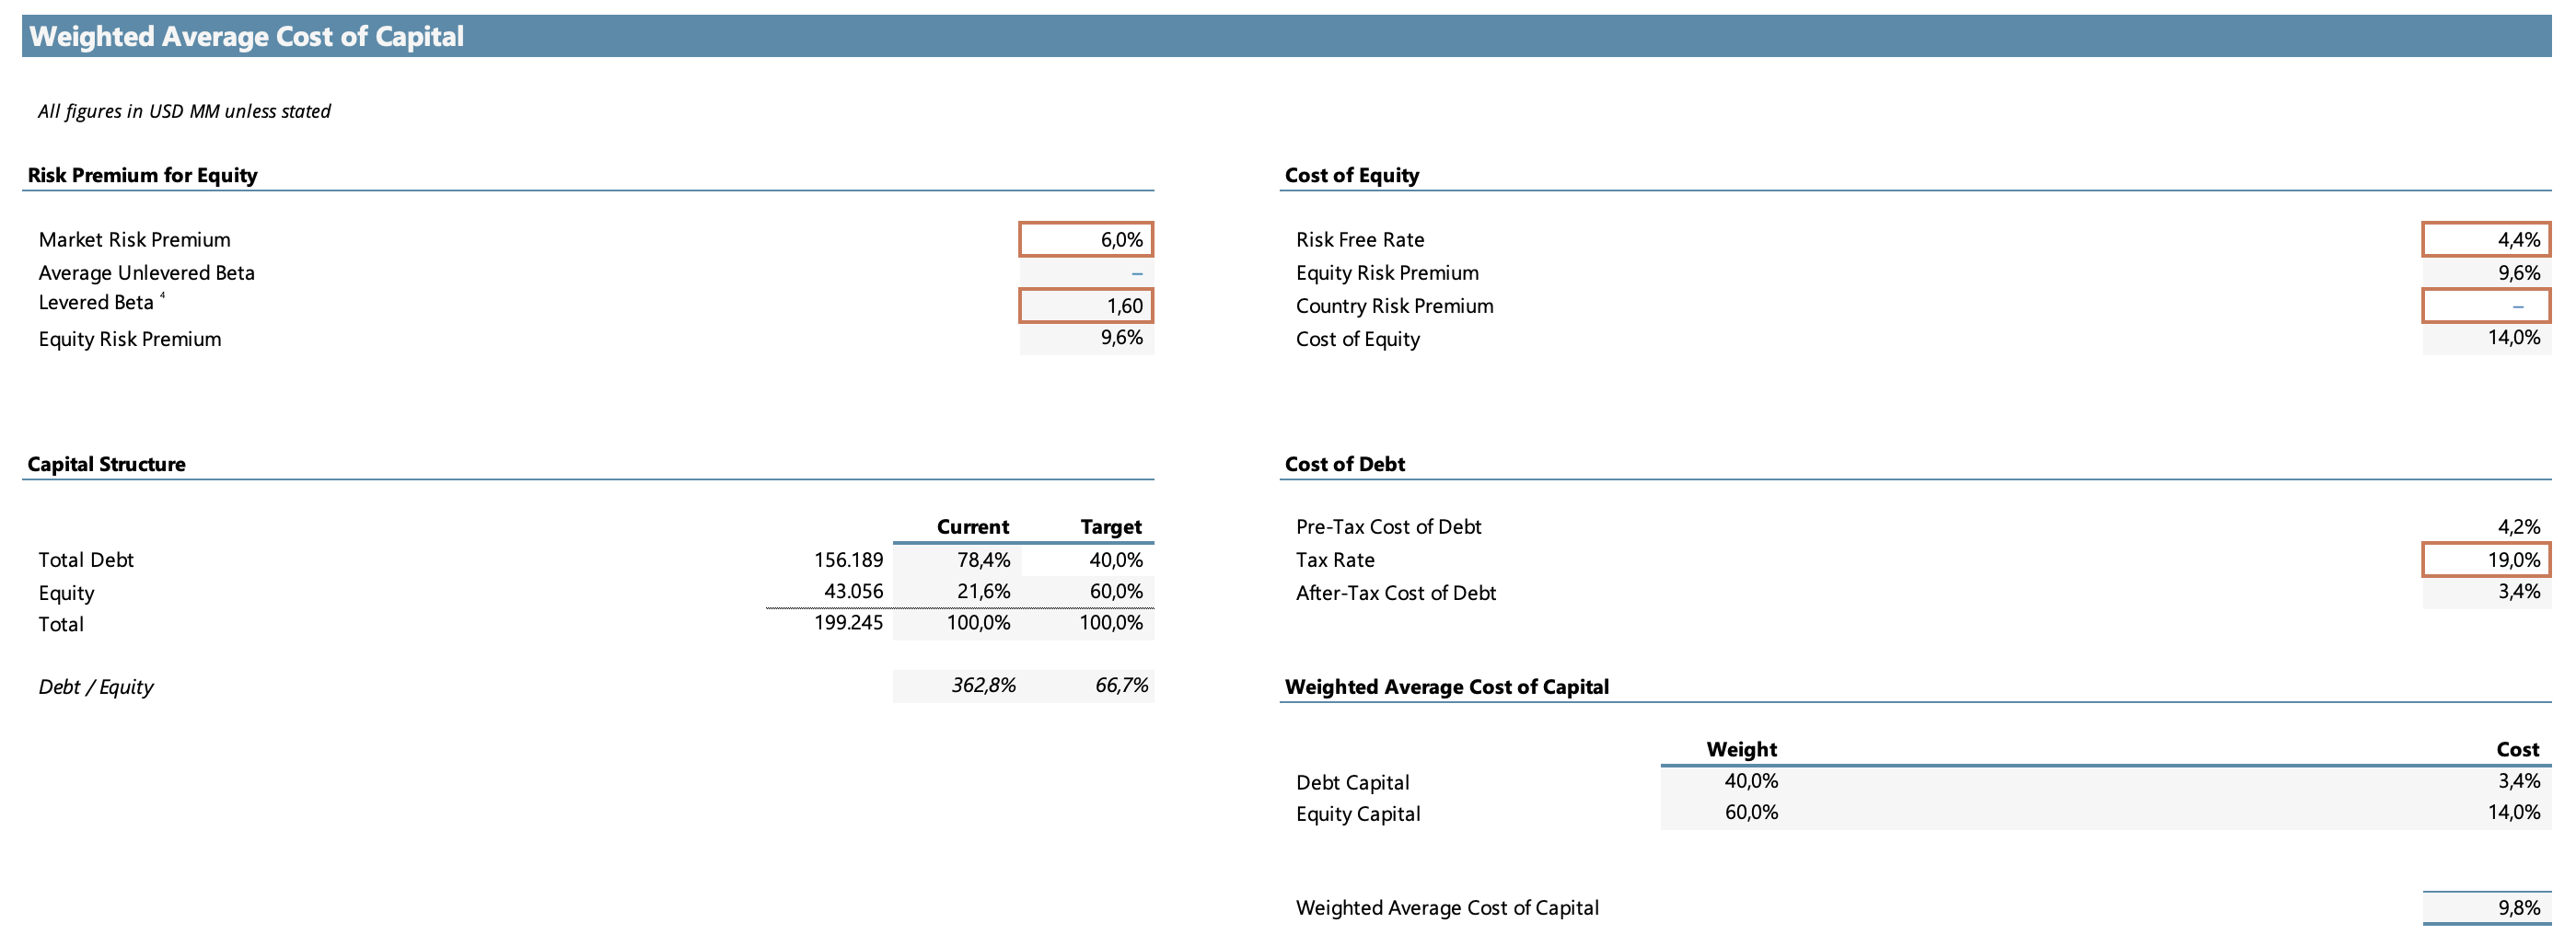
I use a WACC of 9.76% . It’s a demanding WACC for a company of Oracle’s caliber, but I believe it’s reasonable. Oracle has global scale, recurring revenue, a very difficult-to-replace installed base, and highly profitable software businesses. All of that would justify a relatively moderate cost of capital.
However, today’s Oracle also carries more risk than its historical predecessor. The company is making a very large infrastructure bet, with more debt, more capital expenditure, greater reliance on data center execution, and increased exposure to the profitability of artificial intelligence contracts. Furthermore, it competes against companies with stronger balance sheets, such as Microsoft, Amazon, and Google.
For this reason, I don’t use an excessively low WACC. In the model, the WACC combines a high cost of equity, a target capital structure with a higher proportion of equity than debt, and a relatively moderate after-tax cost of debt. The result is 9.76% , which aims to reflect both the quality of the business and the additional risk associated with this new investment phase.
I prefer to be cautious with the WACC because Oracle’s valuation is heavily dependent on future cash flows. The further away the monetization of current capex is, the more important it is to discount those flows with a rate that accurately reflects execution risk.
Terminal growth
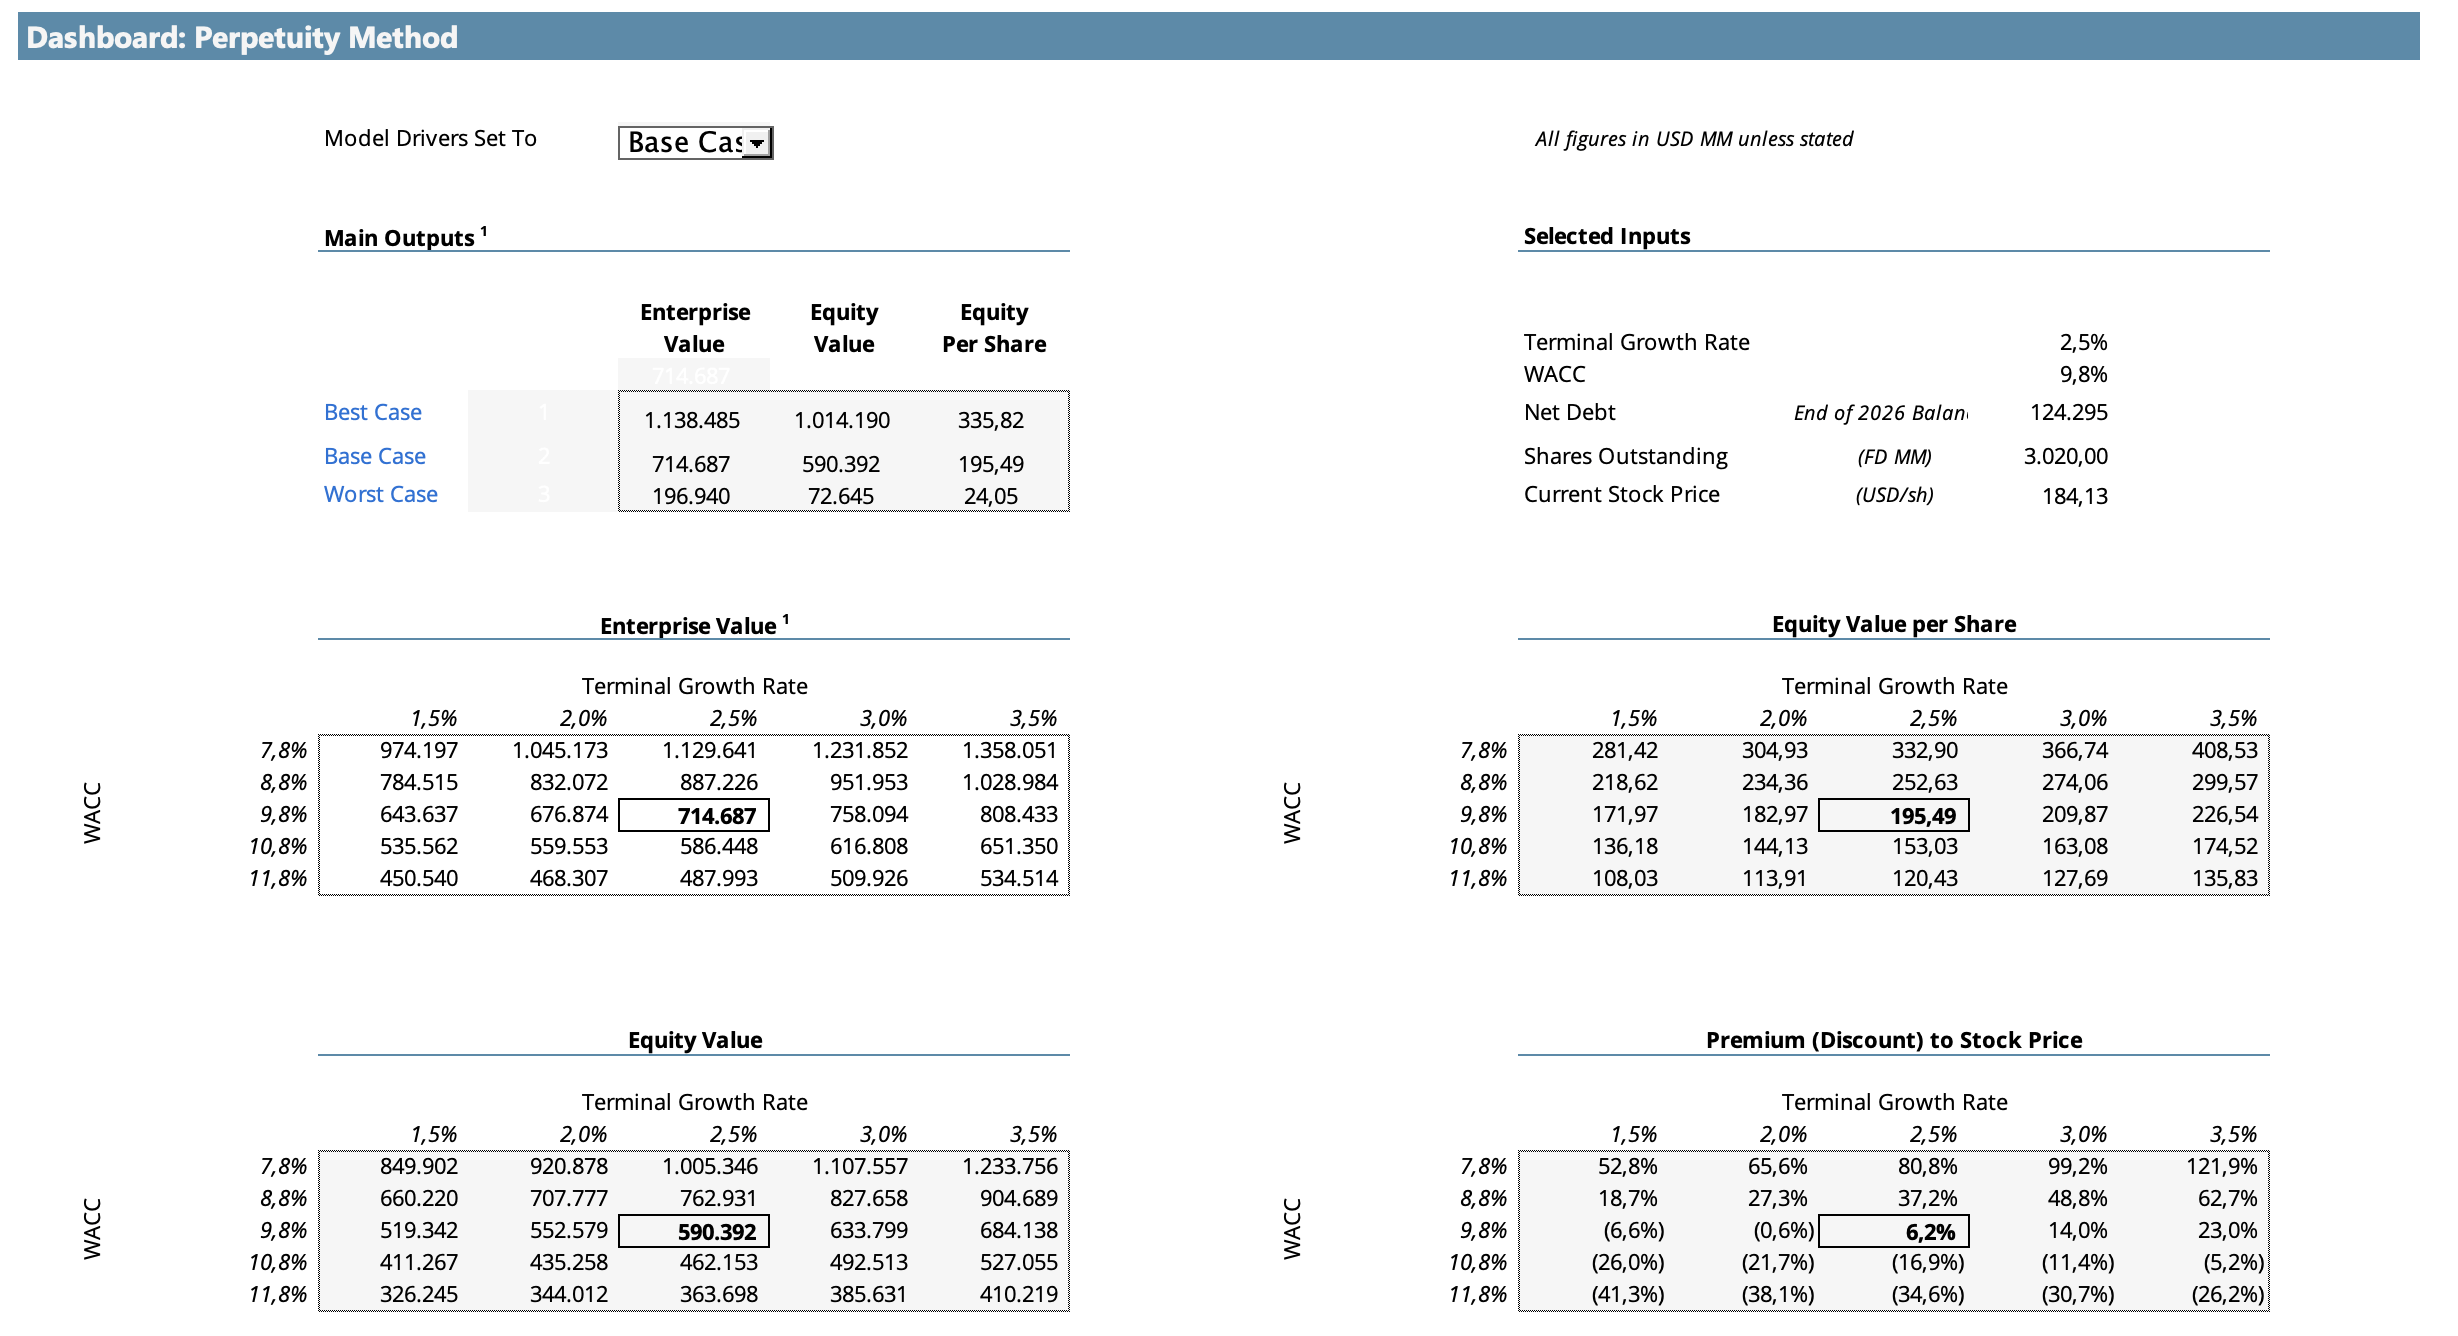
For the perpetuity method, I use a terminal growth rate of 2.5% .
This assumption is conservative and aims to prevent the terminal value from being artificially inflated. Oracle may continue to grow above GDP for several years, especially if OCI gains scale, but assuming an excessively high rate of growth in perpetuity doesn’t seem prudent.
The final year already represents a much larger Oracle, with a revenue base far exceeding its current one. Therefore, I prefer to use long-term growth close to the nominal growth of a mature global company, but without assuming overly aggressive perpetual expansion.
This assumption also balances the model. In a company with high capex and a long transition period, raising the growth terminal too much can lead to a valuation that relies excessively on distant assumptions. I prefer value to come from a reasonable combination of explicit growth, margin recovery, and cash conversion.
EBITDA multiple terminal
In addition to the perpetuity method, I use an EBITDA multiple exit method as a market contrast.
In the base scenario, I use a terminal multiple of 12x EBITDA . In the best case, I use 15x , and in the worst case, 9x .
The 12x base multiple is intended to reflect a mature, profitable Oracle with a much larger cloud platform, but also a more capital-intensive Oracle than in the past. I wouldn’t value it as a pure software company with extremely high margins and low capex. But neither would I value it as a traditional data center company, because Oracle will continue to have software, applications, databases, support, and enterprise relationships that are very difficult to replicate.
That said, the EBITDA multiple method has a significant limitation in this case: EBITDA does not account for the capex needed to sustain the infrastructure .
That point is key. If Oracle reaches its final year with very high EBITDA, but still needs to invest tens of billions of dollars annually to maintain and upgrade its AI capabilities, the EBITDA may overestimate the true economic value. Therefore, in this valuation, the EBITDA multiple method is not the primary approach. I use it as a secondary benchmark, useful for comparing with how the market might value a mature Oracle, but not as the core basis for the target price.
Result by method
The perpetuity method yields the following values per share:
Best Case: USD 335
Base Case: USD 195
Worst Case: USD 24
The EBITDA multiple method yields significantly higher values:
Best Case: USD 581
Base Case: USD 288
Worst Case: USD 35
The difference between the two methods is important and, in fact, tells a large part of Oracle’s story.
The perpetuity method penalizes cash conversion more severely because it’s based on free cash flow—that is, the money remaining after taxes, reinvestment, working capital, and capital expenditures. In a company entering a much more capital-intensive phase, this method seems conceptually more relevant.
The EBITDA multiple method, on the other hand, looks at a metric prior to capital expenditures. This can be useful as a market benchmark, but it can also inflate the value if it is not properly adjusted for the investment required to maintain data centers, GPUs, power, cooling, and networking.
That’s why I don’t assign the same weight to both methods.
Target price
To arrive at my target price, I use a weighting of 80% for the perpetuity method and 20% for the EBITDA multiple method .
The reason is simple: at Oracle, the critical point is not how much EBITDA the company can generate in 2036, but how much free cash flow can remain after sustaining its new infrastructure base.
In the base scenario, the perpetuity method yields a value of USD 195 per share , while the EBITDA multiple method yields USD 288 per share . Weighting both methods, the resulting base value is approximately USD 214 per share .
To round things off, my target price base for Oracle is:
USD 215 per share
With a current price of around USD 184 per share , this implies an approximate upside of 17% .
Conclusion
At these levels, the stock seems interesting to me for long-term investors who are confident in the company’s execution and are willing to tolerate several years of high capital expenditures. However, I would personally wait for a greater margin of safety before initiating a position in Oracle.
The reason is that the execution doesn’t seem like a minor risk to me. Oracle is entering a much more capital-intensive phase, with a huge need for investment in data centers, GPUs, power, and networking. At the same time, the company already has a more leveraged balance sheet than other major technology players. This combination compels me to be more demanding regarding the entry price.
Therefore, although the thesis seems attractive to me, I wouldn’t consider it a buy at the current price. To feel more comfortable, I’d like to see a margin of safety closer to 25% relative to my estimated intrinsic value. In that scenario, I might consider including Oracle in my portfolio, although probably with a relatively small position , at least until I have more evidence that the capex starts to translate into sustainable free cash flow and attractive returns on invested capital.
Thank you so much for reading.
Alan